It’s a November evening in the kitchen, a mug of cold coffee on the table, and a laptop with fifteen tabs open. In one tab, a sellers’ chat where another lucky member just dropped a screenshot with neat order bars and a caption about an “easy entry into the dacha season.” In the next tab, a Chinese wholesale catalog featuring a sleek cordless garden pruner: crisp photos, the factory replies instantly, and your hand reaches for the calculator to order the first batch and wire an advance to the supplier.
Hit pause for twenty minutes and hold off on that transfer. Someone else’s revenue screenshot tells you nothing about how much actual cash the seller keeps after paying for ads, return-trip logistics, and storage on stuck pallets. How do you choose a profitable product on Wildberries with a clear head—relying on hard conversion numbers rather than gut feeling and someone else’s millions? Sustainable selection is built on a two-year check of seasonal trends, filtering out price-dumping listings, and calculating the full funnel from impressions to buyout before the factory sees a single ruble from you. Let’s walk through this entire route step by step using that exact garden pruner and test whether the idea survives contact with real marketplace economics.
The Trap of Someone Else’s Millions and the Two-Year Horizon: Why Stock Charts No Longer Tell the Whole Truth
The first temptation when analyzing garden tools is to open an analytics service, sort listings by monthly revenue, and go copy the category leader. On the storefront, they have thousands of orders and top search positions. Yet the revenue summary stays silent on the price paid for that celebration: how much the overheated ad auction eats up, how much went to influencers, and whether the seller is dumping remaining stock below cost just to pull working capital out of dead inventory.
On top of that, there’s a technical detail that trips up even seasoned sellers. Since 2025, Wildberries has been feeding external analytics platforms—including MPSTATS—less complete warehouse stock data. When a scraper doesn’t see the full warehouse picture or runs into a seller switching to fulfillment from their own warehouse (FBS), a sudden drop in unit counts in the table masquerades as explosive sales growth. You look at a 30-day slice and it seems like the tool is flying off the shelves in a week, when in reality the stock simply stopped showing up.
Product business analyst Anastasia highlights this distortion in a working breakdown for Wildberries supplier channel «Альянс». To avoid mistaking a scraper glitch for a goldmine, I always start a category audit by switching the chart to two years. A one-year slice is too vulnerable to weather: a lingering cold spring shifts peaks by several weeks and gives a false picture of demand capacity.
Over a two-year span, random noise disappears, and your attention shifts from finicky stock counts to three reliable benchmarks:
- Revenue paired with average check. If a subcategory’s revenue holds steady or grows season over season while the average check doesn’t nosedive, the niche has healthy, solvent demand.
- Live review dynamics. A scraper can miscount boxes, but real buyers at pickup points leave a digital trail. A steady inflow of fresh reviews with photos from gardens unmistakably confirms actual sales.
- Active narrow segments within a broad niche. Even when a major category’s chart looks like a flat plateau, inside it you can almost always find growing subcategories—from plant-care systems to hand tools—that are worth digging into.
For our cordless pruner, a two-year view immediately takes off the rose-tinted glasses: instead of guessing from a single month, we see the recurring pulse of the garden tool market.
The Seasonal Express Schedule: Demand Boundaries and the Early-Start Rule
Once you expand the two-year chart for the “Garden & Dacha” section across the full screen, a clear calendar rhythm emerges—when buyers actually wake up from winter and when demand winds down.
Everyday intuition whispers: since gardeners head out to prune trees and dig beds during the May holidays, you should launch your product by May. Now let’s compare that illusion with real two-year charts. In the garden niche, a steady climb begins as early as late January: people stock up in advance on seeds, grow lights, soils, landscape fabric, and spring pruning tools. The active phase runs through mid-to-late May, in early June the curve drops noticeably, and by July sales fade out. Weather shifts the edges of the corridor slightly from year to year, but the core working window from late January to late May remains unchanged.
Seasonal e-commerce on a marketplace works just like boarding an express train with heavy suitcases. If you start packing when the train is already at the platform, you’ll be left at the station with a mountain of boxes whose daily paid storage you’ll have to cover out of pocket. Entering the garden niche in May at the product-selection stage is pointless: you physically won’t have time to manufacture the batch, ship the cargo, package the listing, gather initial reviews, and build rankings before the June slump.
That’s why a strict rule applies: you need to analyze competitors and prepare your shipment at least 2–3 months before the season starts. For spring gardening, the ideal working window opens in November–December. If spring is already in full swing, you calmly collect fresh numbers for next year instead of chasing a departing train.
For our pruner launch, a November start saves a ton of money and nerves: there’s time to negotiate with the factory without rushing, inspect a sample, bring in the batch via standard shipping without overpaying for urgent air cargo, and hit the warehouses by late January for the first wave of buyers.
Hunting the Price Plateau: How to Filter Out Dumping and Find Live Demand Deeper in Search
Knowing the seasonal corridor from late January to May, we move from broad trends to selecting specific listings—and here the main goal is not to copy someone else’s losses.
By late spring, the storefront is covered in crossed-out price tags: a tool that sold for 3,000 in March is being given away for 1,500 in May. A beginner sees a spike in orders and thinks they’ve found a bestseller. In reality, it’s an emergency evacuation: the seller miscalculated stock, got scared of summer storage fees, and crashed the price to zero margin to rescue frozen cash.
In Anastasia’s methodology, the filter is set strictly the opposite way: we select SKUs whose stock sold through on a price plateau (a flat price line) or a rising average check. When a seller’s batch is selling out while the price tag holds steady or gently rises toward peak season, the product hit the mark and carries real profit. Listings that still have heavy stock with an unclear price trajectory a month before the season ends are better set aside and rechecked in a second wave later.
Don’t mistake a sudden drop to zero stock in a scraper for a sales explosion without verifying: incomplete Wildberries data feeds and fulfillment-model switches often paint an empty warehouse out of thin air. Cross-check the price chart against the review feed and immediately check niche concentration: if one brand holds more than 50% of revenue (and in certain cover materials a monopolist takes up to 70%), entering means an unequal war of ad budgets.
Two techniques help you find healthy entry points without a head-on collision with giants:
- Going to pages three and four of search results. Dozens of beginners copy the first page of a broad category. Meanwhile, on pages three and four and under the new arrivals within 30 days filter, you’ll spot fresh listings that recently entered the market and are already holding a steady price plateau without years of history.
- Looking for niches with distributed revenue. It’s far safer to enter where dozens of different brands share turnover and many sellers show missed revenue. In grow lights or garden equipment, the picture is much friendlier to new players than in monopolized roll materials.
After this cleanup, we toss out the price-dumping sellers and gather 20–30 stable competitor SKUs into a working folder (for a quick test you can run the mechanics on 8–9 listings, but before buying with your own money, a sample of twenty to thirty items gives an honest picture).
Metal Staples vs. Pruners: How to Tell a Commodity Dead End from an Improvable Product
Among the thirty selected listings, you’ll inevitably run into ultra-simple goods with brisk sales—and this is where you decide whether you’ll earn on product value or just feed the ad auction.
In apparel, it’s easier to stand out through cut, color, and photography. In household goods, repainting plastic rarely saves you: if the shelf is packed with identical copies from the same factory, the buyer only looks at the first ad slot and a 30-ruble price difference.
Compare two poles within the same garden category:
- Basic commodity product. Simple metal staples for landscape fabric or a 20-liter bag of oilcake. The staples are already rust-proof and fit everything—upgrading a piece of bent metal is nearly impossible. Same story with oilcake: you can change the packaging size, but without deep fertilizer expertise, the buyer won’t see how your bag differs from the one next to it. The outcome is always the same—an endless battle over price and ad bids.
- Product with engineering and bundle-upgrade potential. Branch shredders, cordless cultivators, grow lights, garden tying tapeners, and cordless pruners. On a cultivator, the factory can easily extend the shaft for taller users, add a charge display, upgrade the battery, or tune modes and a comfortable one-handed grip. One thoughtful improvement immediately pulls the listing out of the gray mass of clones.
Let’s go back to that cordless pruner from the Chinese catalog and run the numbers on both scenarios using real factory prices.
On 1688, a basic pruner in a plain box costs 1,200 ₽. If you bring it in unchanged and list it on Wildberries for 2,000 ₽, you’ll run headfirst into dozens of identical Chinese pruners at 1,800 ₽. A gardener has zero reason to overpay you 200 rubles: conversion drops and ads eat the margin.
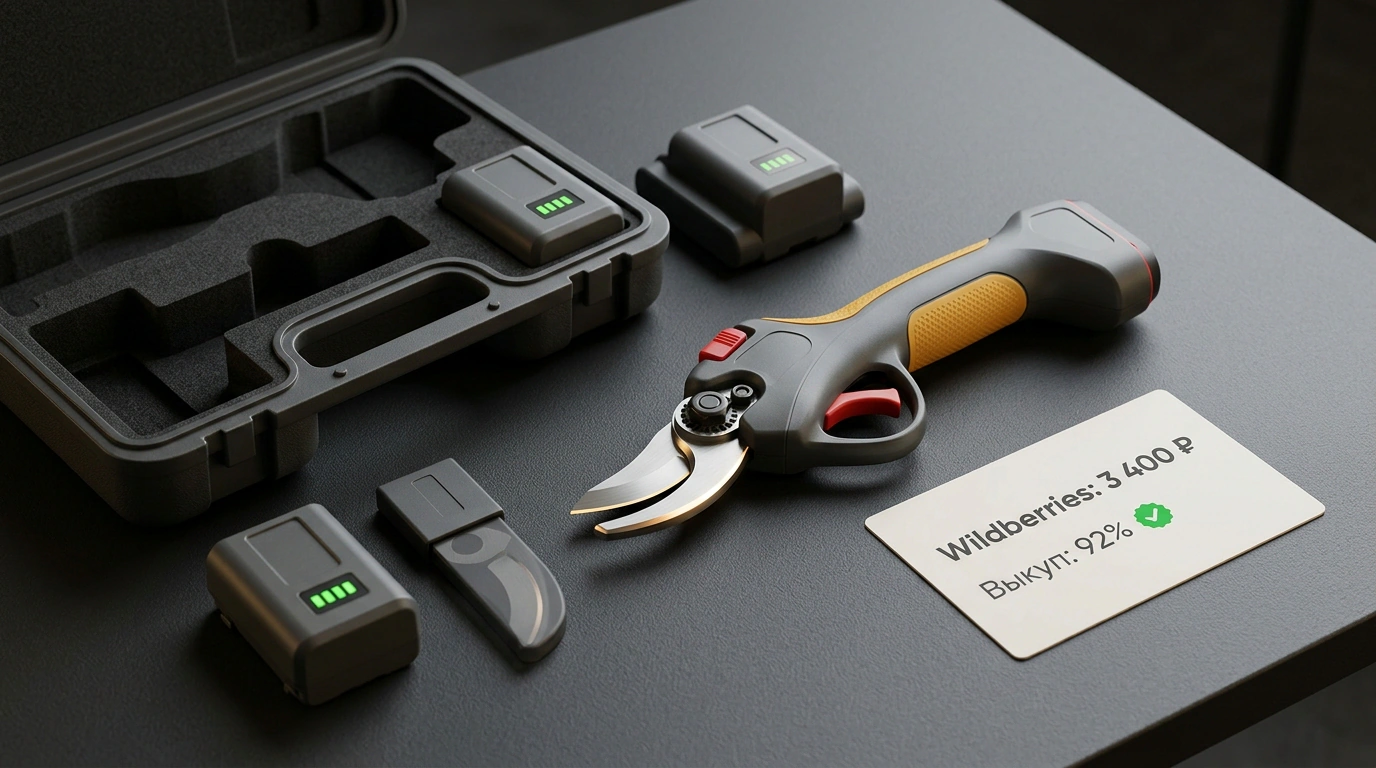
Instead, we change the approach and order a clear upgrade from the factory tailored to real gardener needs: a sturdy storage case, a spare replacement blade, and two high-capacity batteries so apple-tree pruning doesn’t stop dead from a drained cell. The landed cost of the kit rises from 1,200 ₽ to 1,500 ₽—just 300 rubles more. On the marketplace storefront, however, the finished set sells confidently for 3,400 ₽.
The practical payoff here is twofold. By paying an extra 300 ₽ at the factory, you step out of the cramped price brawl of budget copies and add 1,400 ₽ to your ticket. On the cover image, buyers see the solution to their main pain point—all-day battery life and order in the shed—so they gladly choose your listing without you having to discount.
Checking a Product’s Upgrade Potential Before Ordering a Sample
- The design or bundle allows a tangible improvement (second battery, attachments, case, display, handle length)
- Competitor customer reviews directly point out what detail is missing from basic models
- The factory surcharge for the upgrade is several times smaller than the retail price increase of the finished kit
- The difference is readable on the main listing photo within a couple of seconds on a smartphone screen
Product differentiation is ready, but it’s too early to rely on intuition alone—now we need to verify with numbers how the niche audience converts views into actual purchases.
The End-to-End Conversion Sieve: Merging Seller Dashboard Reports and Excel into an Honest Demand Ranking
Picture a buyer’s journey on Wildberries as a five-stage sieve, where each mesh filters out part of the traffic:
Studio product still life on a graphite background showing the five levels of the Wildberries conversion funnel from impressions to pickup-point buyout.
- Search and catalog impressions — everyone who walked past the storefront via search keywords and ad placements.
- Listing clicks (organic CTR) — those hooked by the main photo, price, and bundle on the cover.
- Add-to-carts — buyers who studied the reviews, video, and specs and saved the item for final comparison.
- Orders placed — those who chose your specific offer. The ratio of orders to impressions gives end-to-end conversion (CR), letting you fairly measure the strength of listings against one another.
- Pickup-point buyout — real money, when the person inspects the tool at the pickup point and takes it home.
If you already have live sales and need to tighten weak links in an existing listing, check out the breakdown of step-by-step tuning for every stage of the Wildberries sales funnel. Before purchasing inventory, though, we use the platform’s internal analytics to X-ray competitors’ listings from the inside.
In Anastasia’s algorithm, pairing the seller dashboard with Excel works in four clear steps:
- Open the «Сравнение карточек» tool in the WB seller dashboard (alongside data from «Аналитика по карточкам товара»). Each check accepts a batch of 2 to 5 SKUs. Beyond the free subscription allowance, a comparison pack costs 50 to 140 ₽ (50 ₽ used to be the price for a pair comparison, while a five-listing pack costs 140 ₽).
- Export data for our 20–30 competitors to Excel, remove system-difference rows between listings and past periods. Keep four columns: SKU, median buyer price (including the permanent buyer discount — СПП), impressions, and orders. If a technical bug shows price as zero or columns are blank for seller-warehouse fulfillment, verify the working price manually on the listing’s chart.
- Calculate
CR = Orders / Impressions × 100%and compare listings within similar price segments. - Run ad and visual diagnostics on the leaders: if a high CR is inflated by expensive external influencer integrations that you don’t plan to run, cross it out and pick SKUs growing on clear internal traffic.
Here lies a major trap of the penny ticket. In the garden sample, the highest CR belonged to the product «Абига-Пик» with a median price of 451 ₽ (around 500 ₽ before marketplace discount). Beginners on a tight budget are mesmerized by that percentage: minimal investment, fast turnover. Yet on 300–450 ₽ items, marketplace commission and base logistics (from 50–70 ₽ per unit) eat up to 60% of the price, leaving almost no room for ads. Grow lights at 791 ₽ have half the end-to-end conversion, yet the ruble margin is far more tangible. Meanwhile, comparing two landscape fabrics at 1,635 ₽ and 1,665 ₽ at the same price point immediately reveals the leader and the laggard in return per impression.
On our upgraded pruner in a case at 3,400 ₽, that same funnel turns into a concrete monthly plan:
| End-to-End Funnel Stage | What Drives This Step | Monthly Pruner Benchmark |
|---|---|---|
| 1. Search and catalog impressions | Seasonal demand, relevant keywords, and ad auction | 50,000 impressions |
| 2. Listing clicks | Cover with case, blade, and two batteries (4.5% click share) | 2,250 clicks |
| 3. Cart and order | Differentiation from bare 1,800 ₽ models (12% click-to-order conversion, 0.54% overall to impressions) | 270 orders |
| 4. Net buyout at pickup point | Build quality and complete kit with no surprises (92% buyout) | 248 units sold |
A table like this turns a launch from a lottery into a manageable engineering task. You see exact benchmarks before you even start: within the first few thousand test impressions, it becomes clear whether the cover delivers the target click share and converts one in eight visitors into an order, or whether you need to quickly tweak the infographics before the main seasonal peak arrives.
Final Math Before the Factory Advance: Buyout Rate, Reverse Logistics, and the Price of Peace of Mind
Placed orders on a screen aren’t cash in the register yet: real economics are sealed by the final filter of buyout rate and full warehouse costs.
Here, garden and household goods beat apparel hands down. In dresses and jackets, buyout often drops to 30–40%, forcing the seller to pay for empty round-trips on two-thirds of the batch. In garden and dacha goods, buyout holds at 90–98%: nobody orders a tool to try it on in front of a mirror. Still, the spread within the category is noticeable: landscape fabric delivers 98% buyout, grow lights and solid garden tools hit 92%, while mini-greenhouses dip to 88%. A 10-percentage-point gap on a seasonal batch turns into dozens of extra returns and repackaging costs, so a 90% buyout floor is worth keeping as a baseline filter.
Before wiring money to the supplier, we tally net unit economics:
- Manufacturer tender. Don’t buy from the first factory on 1688: request kit quotes from at least five to seven plants in a separate spreadsheet to squeeze out the best purchase price without sacrificing steel quality or battery cells.
- Full calculation of deductions and taxes. Subtract category commission, outbound shipping on all orders, reverse logistics on the 22 unbought cases, storage, and tax on the full retail selling price from revenue. You can verify the detailed deduction mechanics using a step-by-step calculation of honest unit economics and margins on Wildberries, while also factoring in how СПП dynamics across price segments change total marketplace deductions.
- Buffer for 2027 seasonal tariffs. Wildberries regularly indexes logistics and paid storage coefficients ahead of peak season, so build warehouse headroom into your numbers early.
Now the entire economics of our garden pruner sit in plain sight. Instead of blindly buying a basic tool at 1,200 ₽ for a dreary brawl with clones, we budgeted a kit upgrade to 1,500 ₽ and entered the 3,400 ₽ segment. At a 92% buyout rate, the resulting 248 net sales per month leave the entrepreneur with over 320,000 ₽ in net profit after all commissions, logistics, and taxes. And if the numbers in the spreadsheet hadn’t added up, the check would have cost a couple hundred rubles in the analytics dashboard instead of half a million frozen in a warehouse.
After all, to be completely honest, none of us go into business for sleepless nights over cash-gap charts and constant dread of paid storage bills. All this meticulous math of two-year trends, price plateaus, and conversion sieves isn’t for pretty spreadsheets—it’s for your peace of mind. When you calculate a product upfront with a cool head, the business stops draining your nerves and finally gives you back what matters most: free time for family, confidence in tomorrow, and genuine enjoyment from building something real.
