If your business sells both online and in brick-and-mortar stores, you've definitely run into the classic marketing tug-of-war: where should the next million rubles go? One camp insists, "Put it all into search and paid social—clicks are transparent and the analytics are crystal clear!" The other pushes back: "Without outdoor ads in the city, we lose brand awareness and our stores go empty!"
In luxury and jewelry retail, that dilemma is even sharper. Nobody buys a diamond ring on impulse from the first ad link they tap. They see mobile ads for weeks, walk past billboards on their commute, talk it over with family, visit a showroom to try on pieces, and only then pull out their card.
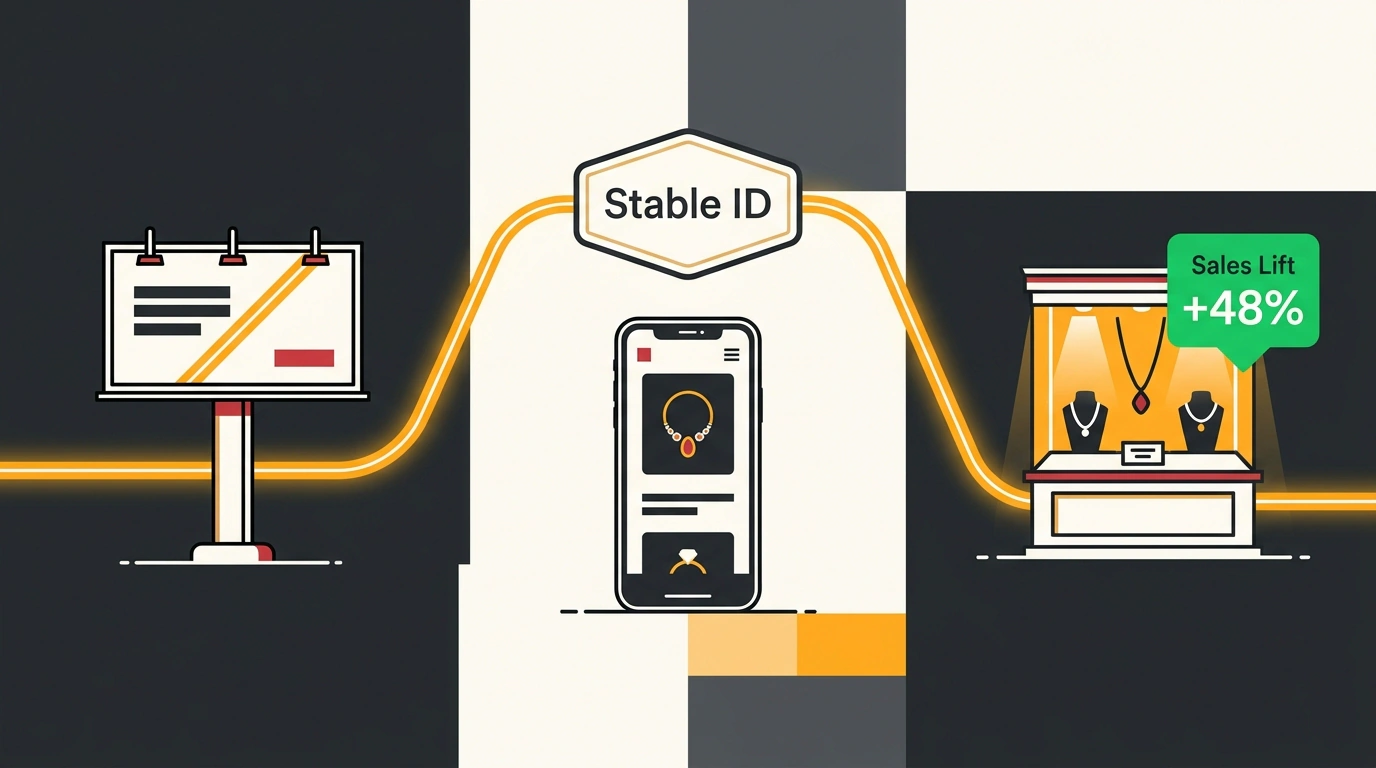
For a long time, channels lived in silos: nobody could reliably measure how many people walked into a store after seeing a web banner, or how outdoor billboards drove carts in an app. Jewelry chain MIUZ Diamonds teamed up with ad group ADV (ADV+Endemika) and telecom provider MTS AdTech to run a large-scale study connecting every touchpoint through a unified Stable ID.
Stitching Architecture: How Stable ID Works
Traditional web analytics has two glaring blind spots: the death of third-party cookies and constant device switching. Someone sees an ad on a laptop, searches on their phone, and buys at a mall. To standard analytics, that's three different strangers.
Stable ID solves this at the mobile carrier infrastructure level:
- Persistent anonymized profile: the identifier is built on telecom Big Data and doesn't rely on browsers or get tripped up by ad blockers.
- Unifying four data streams:
- OOH exposures: billboard GPS coordinates and minute-by-minute ad schedules matched against subscriber movement trajectories.
- Digital logs: impressions and clicks on display banners and search ads across the web.
- Online activity: catalog views, product page visits, and reservations on the MIUZ Diamonds website.
- Offline receipts: point-of-sale transactions in the chain's retail boutiques.
- Three-tier model: ad exposure -> brand engagement (site visits and store footfall) -> purchase (basket size, items bought, repeat visits).
The scale of the test is striking: over a two-month campaign (July–August), the system logged 44.2 million events and analyzed 7,596,440 unique customer journeys.
Channel Synergy: The Numbers That Surprised Marketers
Stitching the data together completely upended conventional wisdom about what each media channel actually does.
First, it revealed a massive ROPO effect (Research Online, Purchase Offline): 53% of all retail store purchases were made by shoppers who had previously seen the brand's digital ads. The internet wasn't just driving website traffic—it was the main engine behind cash-register revenue at the mall.
Second, out-of-home (OOH) advertising delivered an unexpected lift to e-commerce: 87% of online store orders were preceded by exposure to street billboards. Outdoor acted as a powerful trust trigger that prompted people to open a search bar later.
Third, 40% of retail store buyers visited the brand's website on the exact same day they walked into a boutique. They were checking SKUs, verifying ring sizes in stock, and confirming store addresses. For more on why tracking the full touchpoint chain matters in modern retail, see our analysis of the e-commerce retention crisis.
Connecting online and offline touchpoints delivered a +48% overall lift in transactions, an +8% increase in purchase frequency per customer, and a +17% jump in average order value.
Frequency Optimization: Saving Budget from Ad Fatigue
Arguably the most practical takeaway from the study was pinpointing the effective exposure frequency.
Marketers used to argue endlessly over how many times a person needs to see a billboard or banner. By plotting marginal acquisition cost curves for each city and format, analysts identified the exact threshold where the CPA Index drops below 100. Every impression served beyond that cap brought zero extra sales—it just burned budget on audience fatigue.
By trimming excess impressions, the team freed up media budget and redirected it toward reaching fresh audiences. The takeaway for any business is clear: once you can see the full customer path from a street billboard to a store receipt, advertising stops being a guessing game and becomes an exact engineering discipline.