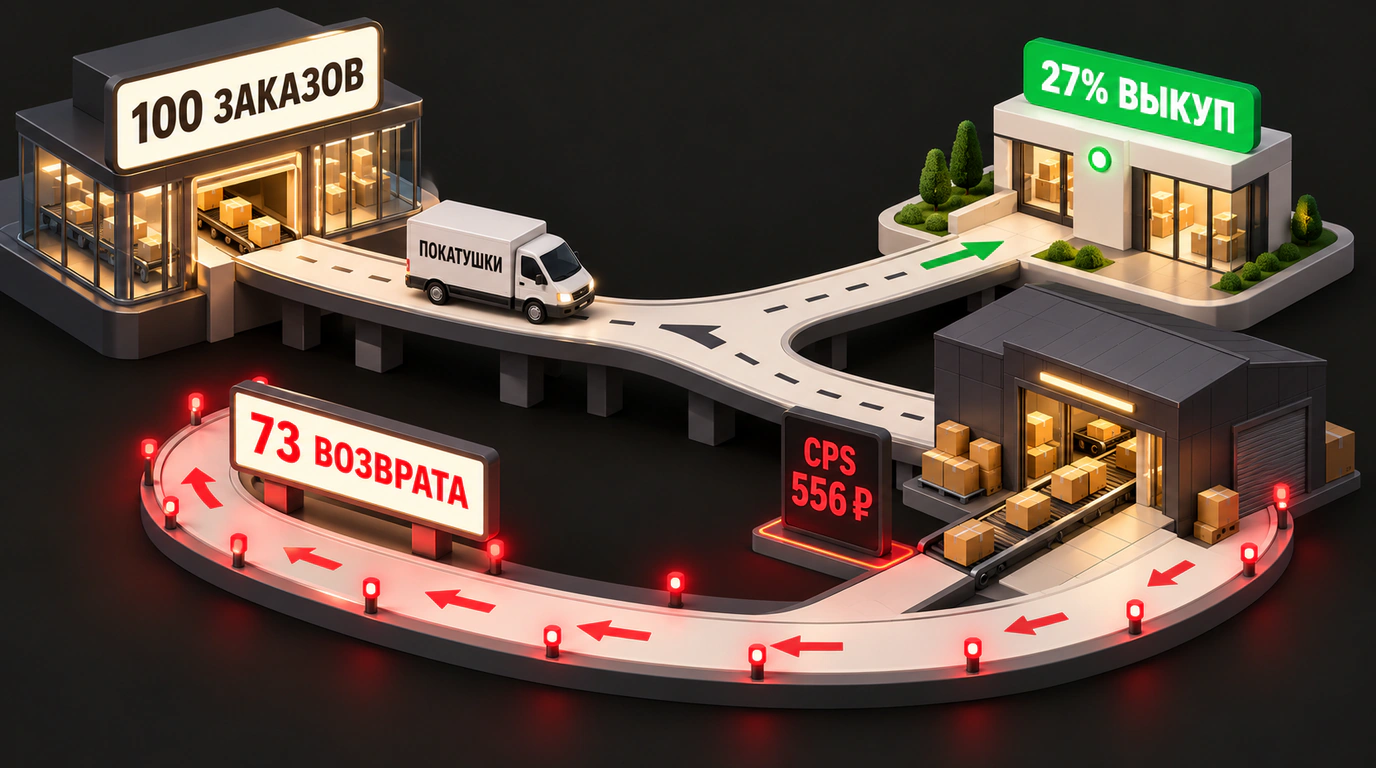
You've probably seen those proud ad-dashboard screenshots floating around seller chats: "Look at this—1.6 million rubles in orders on just 50,000 rubles of ad spend! ACoS under 3%! Time to scale!" From the outside, it looks like a slam dunk. Yet if you check that seller's actual bank statement two months later, you'll likely find a gaping cash-flow hole.
Why does this happen? Because seller analytics are plagued by a dangerous illusion: mistaking placed orders for actual money in the bank. The author of the Telegram channel Andrey: About Wildberries, Ozon and More broke down a textbook case that exposes this exact self-deception. Let's run the numbers together and see what those "empty round trips" between sorting centers actually cost.
Order ACoS vs. Sales ACoS: How Profit Evaporates
The funnel starts with a deceptively clean metric. A seller has a product priced at 2,800 rubles (after SPP). They launch internal ads at roughly 5,000–6,000 rubles a day, and orders pour in: the Cost Per Order (CPO) sits at a modest 150 rubles.
On the surface, the Advertising Cost of Sales (ACoS, or DRR in Russian seller parlance) looks magical: divide 150 by 2,800 and you get roughly 3% (just over 5% on raw price, or ~3% on their reported base). Margins seem wide open for huge profits. There's just one catch: this is apparel, where shoppers order three sizes to try on at home or in the fitting room, and the actual buyout rate is only 27%.
Now pull out a calculator and recalculate by Cost Per Sale (what it actually costs to get one paid, kept order):
Let that sink in: for every item that actually stays sold, the seller isn't paying 150 rubles in ad spend—they're paying over 550 rubles! Real ACoS against net cash jumps from 3% to 10–15%. On paper, gross ordered revenue cleared 1,600,000 rubles, yet only around 430,000 rubles in gross sales will ever hit the bank account. And that's just the tip of the iceberg. As we've seen before when examining how unit economics and margins on Wildberries break down under the wrong calculation base, taxes and commissions apply to realized sales while ad spend quietly eats whatever margin is left.
The Hidden Bill for 'Round-Trip Rides' and Paid Storage
The biggest silent profit-killer at a 27% buyout rate is reverse logistics. Imagine a batch of 100 placed orders:
- 27 units are picked up and paid for at the pickup point (PVZ);
- 73 units get tried on, stuffed back into a bag (neatly or not), and handed back to the counter clerk.
Here is the tab Wildberries hands the seller for those 100 shipments:
- Outbound logistics: you pay delivery to the pickup point on all 100 units, no exceptions.
- Return logistics: for each of those 73 returns, Wildberries deducts the base return fee (averaging 33 to 50+ rubles per unit depending on volume).
- Paid pickup-point storage: if a buyer drags their feet on pickup, daily storage of 10 rubles per unit kicks in starting day 4.
- Lost salable condition: after two or three fitting-room trips, clothes get wrinkled, polybags rip, and barcodes scuff. If a unit is flagged as damaged packaging, it either goes to paid disposal (from 33 rubles) or comes back to you with extra deductions.
On top of that comes working-capital freeze. While 73 units ride the "warehouse → pickup point → sorting hub → back to shelf" loop, 10 to 14 days vanish. Stock sits out of rotation, forcing you to inject more cash just to keep shelves full while the marketplace takes over half the revenue in fees—a structural shift we dug into in Wildberries' SPP dynamics: why the marketplace takes 56% of revenue.
If a listing's buyout rate drops below breakeven (33–35% for most apparel categories), scaling ads is strictly off-limits. Raising your ad budget from 50,000 to 200,000 rubles won't earn you more—it will just generate return-logistics losses four times faster.
The Exit Playbook: How to Stop the Bleeding
Caught your own listing in this trap? Step one is freezing your ad bids immediately and auditing the funnel, just as outlined in our Wildberries sales funnel guide to converting impressions into buyouts.
The rescue plan comes down to three moves:
- Audit return reasons in reviews and Q&A: if shoppers complain an item "runs a size small" or "looks darker than the photo," ads can't fix that. Reshoot video in natural light and add an accurate size chart with tape-measure garment dimensions to your infographics.
- Upgrade individual packaging: ditch flimsy adhesive polybags for heavy-duty 80+ micron zip-lock bags. They protect fabric during try-ons and keep the item crisp for the next buyer.
- Distribute stock across regional clusters: the closer inventory sits to the customer, the faster it arrives—and the fewer cancellations you get because an outfit "didn't arrive in time for the event."
The takeaway is simple: there's no room in e-commerce for getting starry-eyed over pretty order-volume charts. Track CPS on actual buyouts, police your return-trip costs, and only scale the SKUs that leave real cash in your account.

