Think about how troubleshooting a tricky outage usually goes in your project. One browser tab has a Grafana dashboard showing a spike in 5xx errors and connection pool saturation. Another tab has a runbook in Notion or Confluence, written a year ago by a teammate who has since left the company.
You stare at the chart trying to figure out: are 400 active database connections a normal peak load, or an impending meltdown? Grafana gives you nowhere to explain that beyond a tiny panel tooltip. And trying to embed a dashboard via an iFrame into a corporate wiki usually crashes into authentication walls and a complete lack of versioning.
The creators of the popular Go library ttlcache decided to bridge this context gap and released the open-source project Oxynote under the Apache 2.0 license. They call the concept "breathing docs"—a knowledge base where live metrics and runbook prose live side by side.
Live Metric Blocks Right Inside the Prose
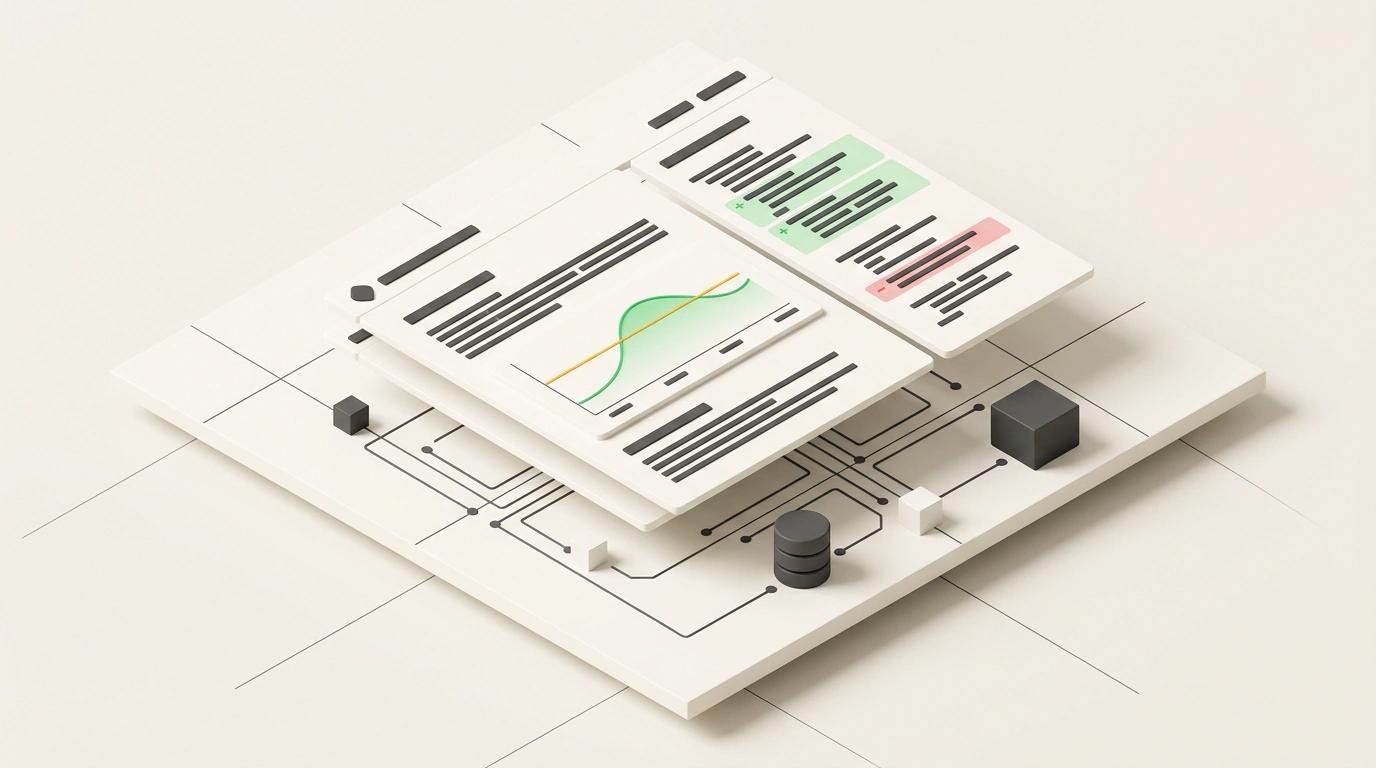
Instead of static screenshots or external frames, Oxynote uses native Live Metrics blocks. Time-series charts, histograms, or gauges sit directly inside a normal documentation paragraph.
Each block connects straight to a data source, supporting PromQL queries against Prometheus and direct SQL against relational databases (PostgreSQL, MySQL, MariaDB). Right beneath the chart, you write the threshold criteria: "If the error rate exceeds 5% for more than 3 consecutive minutes, follow these steps." An engineer sees both the live numbers and the exact playbook in a single window.
A Code-Review Workflow for Technical Docs
Another classic documentation pain point is accidental, unreviewed edits. In Confluence, anyone with edit permissions can tweak a critical command or delete an important environment variable.
In Oxynote, pages can be switched into mandatory Review Workflow mode. Any change creates a draft branch. When submitted for review, the system generates a visual block-level diff highlighting:
- which text paragraphs changed;
- which fields in API schemas were added or removed;
- how a PromQL query inside a monitoring block was modified.
Changes merge into the main runbook branch only after explicit approval from an assigned reviewer, bringing familiar Git reliability standards to documentation.
To stop runbooks from turning into a digital graveyard, Oxynote offers Freshness Hooks. A block or document can be linked to commits in a service's GitHub repository, a new container tag release, or a calendar schedule. If a microservice gets updated and nobody opens its runbook for more than three months, the system automatically notifies the author that a review is due.
Quick Start and Declarative Block Definitions
Oxynote ships as a self-contained container built with Go and TypeScript and requires no external cloud dependencies:
# Start the container with a local volume for persistent data
docker run -d --name oxynote \
  -p 8080:8080 \
  -v oxynote_data:/oxynote/data \
  --restart unless-stopped \
  ghcr.io/oxynote/oxynote:latest

# Web UI is available at http://localhost:8080
# Default login: admin@example.com / oxynote-admin-1234
Inside a page, a live metric block is defined declaratively, tying monitoring queries directly to the written instructions:
block_type: live_metric_chart
chart_type: time_series
title: "Auth Service Request Rate (HTTP 2xx vs 5xx)"
sources:
  - id: prometheus_cluster
    type: prometheus
    url: "http://prometheus.internal:9090"
    query: "sum(rate(http_requests_total{job="auth-api"}[5m])) by (status)"
    legend: "HTTP {{status}}"
  - id: db_pool
    type: postgresql
    dsn_secret: "POSTGRES_METRICS_DSN"
    query: "SELECT now() AS time, count(*) AS active_connections FROM pg_stat_activity WHERE state = "active";"
    legend: "Active DB Connections"
display:
  unit: "req/s"
  thresholds:
    warning: 500
    critical: 1000
explanation: |
  If the HTTP 5xx error rate exceeds 5% of total traffic for more than 3 consecutive minutes,
  check PostgreSQL connection pool utilization on the chart to the right and follow Runbook #12.
Oxynote doesn't replace Grafana outright yet—it lacks Loki-grade log aggregation or a complex alert routing engine. But for runbooks and microservice architecture docs, this hybrid of wiki and monitoring saves precious minutes when production is on fire.