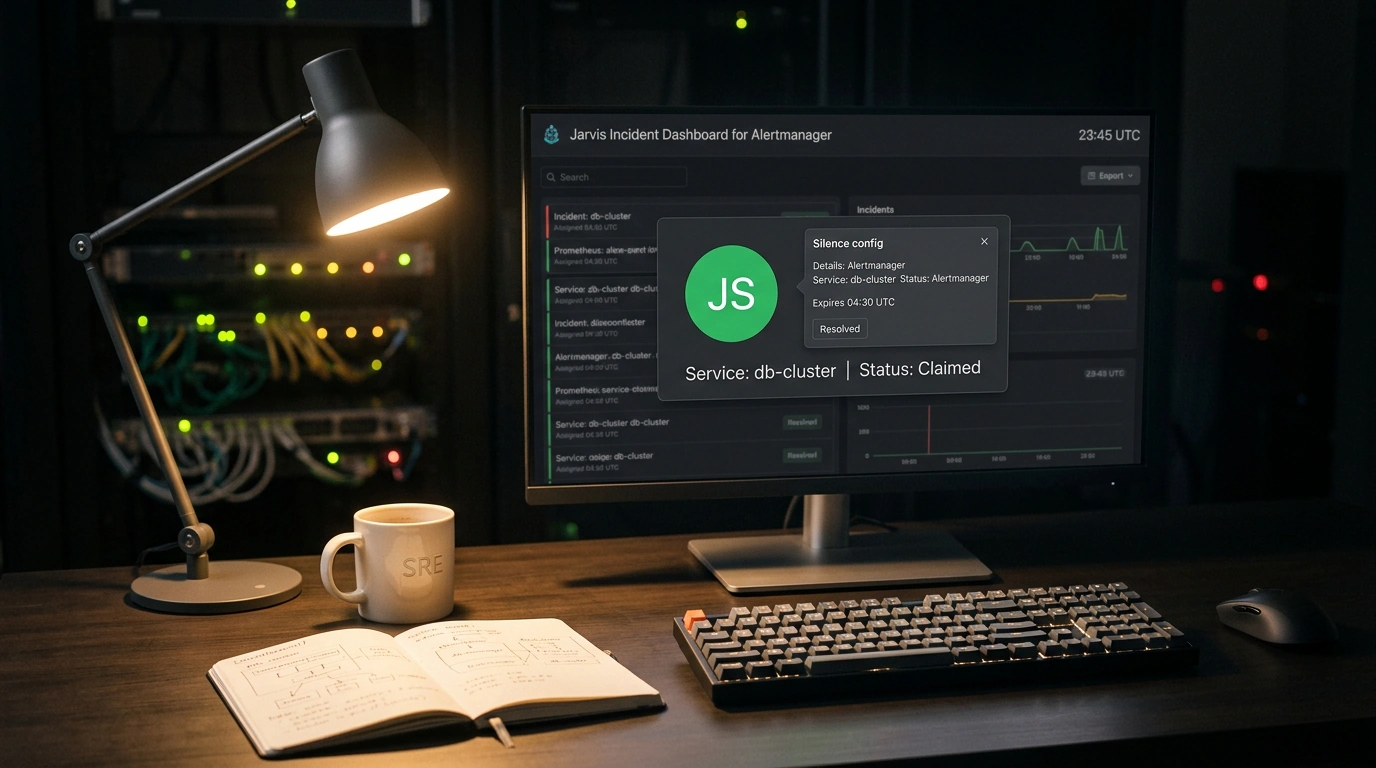
If you have ever been on call for production infrastructure, you know that sticky feeling of disorientation during a cascading outage. Dozens of red tiles light up in your monitoring dashboard, your pager won't stop buzzing, and team chat descends into chaos: "Who's looking at the database?", "Am I checking the network or are you?", "Why has this alert been hanging for half an hour?"
The built-in Prometheus Alertmanager web UI was designed as a bare-bones tool for checking rules and creating silences. Popular alternatives like the Karma dashboard noticeably improved visualization, yet didn't solve the core problem: it is still a static "fishbowl" showing only a snapshot of the current state. The moment an alert disappears due to a brief network hiccup, the entire chain of context vanishes with it.
German engineer Kevin Jahns built Jarvis—an open-source, self-hosted application written in Go and pnpm that turns Alertmanager from a passive status board into an interactive incident response console.
One-Click Claiming and Persistent History
Jarvis's main architectural insight is having its own lightweight storage layer. By default, the service uses a local SQLite database (and for high-availability multi-replica clusters, it can connect to PostgreSQL).
What does this give an on-call shift in practice? First, one-click claiming. You click a button on the incident card, and the whole team immediately sees your avatar: the issue is taken, no duplicate effort needed. Second, persistent notes and comments. Every entry is tied not to a transient event ID, but to the alert's stable cryptographic fingerprint. If a database flaps once a week, the on-call engineer immediately sees past postmortems and ready-made runbook steps right inside the card. Third, a Grace Period mechanism. During a brief network blip between Jarvis and the upstream server, alerts don't vanish from the screen instantly, preventing the false impression that the problem resolved itself.
Safe Silences: Guardrails Against Human Error
Another classic SRE headache is creating silence rules. One typo in a regular expression or an overly broad label matcher (such as env=~"prod.*") can mute half the company's critical services and make you miss a real outage.
Jarvis includes an interactive Silence Preview. As you type filter conditions, the UI queries the live alert pool on the fly and highlights the exact list of notifications that will be muted. You see the blast radius before you ever hit confirm.
Jarvis is designed for safe deployment inside an internal perimeter. Out of the box, the container image runs as an unprivileged user with read_only: true and all kernel capabilities dropped (cap_drop: ALL). However, the application has no built-in public registration system: you should put it behind a corporate VPN or a reverse proxy with OIDC/SSO authentication.
Deploying with Docker or Podman
Jarvis ships as a single compact OCI image and connects to Alertmanager via the standard HTTP API v2. Here is a ready-to-use compose.yaml manifest combining production and staging environments:
services:
  jarvis:
    image: ghcr.io/kj187/jarvis:2.1.0
    container_name: jarvis
    ports:
      - "8080:8080"
    volumes:
      - jarvis_data:/data
    read_only: true
    tmpfs:
      - /tmp
    security_opt:
      - no-new-privileges:true
    cap_drop:
      - ALL
    environment:
      # Connect the first Alertmanager cluster (Production)
      JARVIS_CLUSTER_1_NAME: "production"
      JARVIS_CLUSTER_1_ALERTMANAGER_URL: "http://alertmanager-prod.internal:9093"
      JARVIS_CLUSTER_1_AUTH_TYPE: "bearer"
      JARVIS_CLUSTER_1_AUTH_TOKEN: "${ALERTMANAGER_TOKEN}"

      # Connect the second Alertmanager cluster (Staging)
      JARVIS_CLUSTER_2_NAME: "staging"
      JARVIS_CLUSTER_2_ALERTMANAGER_URL: "http://alertmanager-stage.internal:9093"

      # Local storage and polling interval settings
      JARVIS_STORAGE_TYPE: "sqlite"
      JARVIS_STORAGE_SQLITE_PATH: "/data/jarvis.db"
      JARVIS_POLL_INTERVAL: "15s"
      JARVIS_GRACE_PERIOD: "45s"
    restart: unless-stopped

volumes:
  jarvis_data:
    driver: local
Once the container is up, verify that the configuration loaded cleanly and check the health endpoint:
# Start the service in the background
podman compose up -d

# Check initialization logs and cluster connections
podman logs -f jarvis

# Verify web UI availability
curl -fsS http://localhost:8080/healthz || echo "Initializing service..."
For small and mid-sized infrastructure teams, Jarvis looks like an ideal middle ground: it plugs the gaps in standard Alertmanager without forcing you to deploy heavyweight commercial incident-escalation platforms.