It is a classic backend detective story: the on-call engineer spots a sharp latency spike on a Go service's HTTP endpoints in Grafana. Requests are taking a full second instead of the usual 20 milliseconds. Naturally, they dive into the database logs, turn on the slow query log, and find something baffling: PostgreSQL or MySQL is spotless. Every single SQL query finishes in a brisk two milliseconds.
So where are those hundreds of milliseconds disappearing? They are vanishing inside a queue invisible to your database—right inside Go's standard database/sql package. The delay happens before the first byte even hits the wire: goroutines are blocking on an internal semaphore inside your application, waiting for a free TCP socket from the pool. We saw a similar illusion in PostgreSQL Is Slow While CPU Is Idle: Hunting Heavy Queries with pg_stat_statements, where healthy CPU graphs hid the real bottleneck.
How the Pool Works and Why Starvation Happens
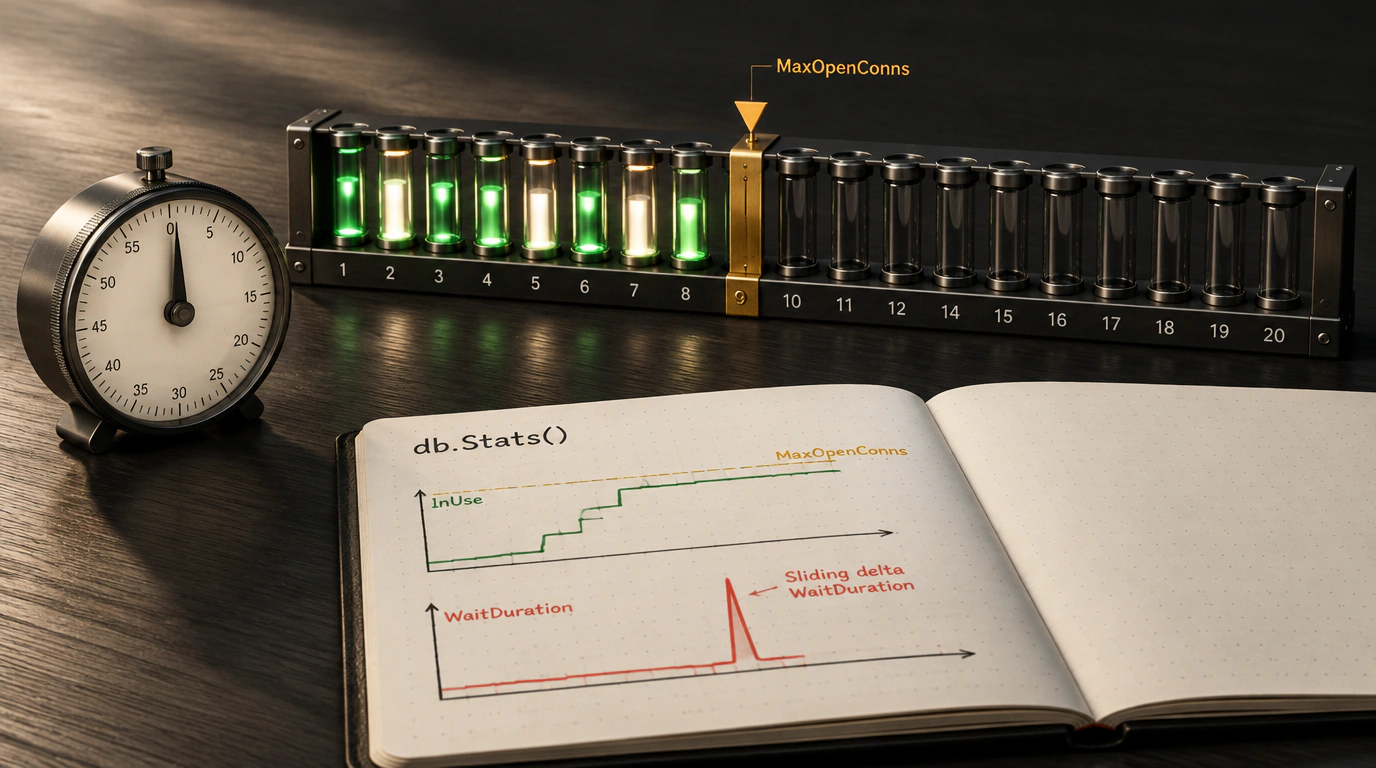
In Go, *sql.DB is not a single network connection—it is a thread-safe connection pool. Whenever your code calls db.Query() or db.Exec(), the runtime grabs an idle socket from the pool or opens a new one if the total count is below SetMaxOpenConns.
Once that limit is reached and every connection is busy, incoming goroutines go to sleep on a mutex. If someone forgets to call rows.Close(), or if a transaction stalls waiting on an external HTTP call, that socket never returns to the pool. New requests pile up behind it, triggering cascading pool starvation.
Tuning the pool properly means balancing four parameters:
package main

import (
    "database/sql"
    "time"

    _ "github.com/jackc/pgx/v5/stdlib"
)

// InitPool configures predictable boundaries for the connection pool
func InitPool(db *sql.DB) {
    // Hard ceiling on physical sockets (InUse + Idle)
    db.SetMaxOpenConns(40)

    // Number of warm idle connections kept ready
    db.SetMaxIdleConns(20)

    // Rotate sockets to guard against memory leaks and DNS changes
    db.SetConnMaxLifetime(30 * time.Minute)

    // Close excess idle sockets when traffic drops
    db.SetConnMaxIdleTime(5 * time.Minute)
}
Introspection via db.Stats() and Delta Tracking
To catch this in production, the standard library gives you db.Stats(), which returns an sql.DBStats struct tracking pool health:
InUse: how many sockets are actively running queries right now;Idle: how many ready-to-use connections are waiting for work;WaitCount: how many times goroutines had to block waiting for a slot;WaitDuration: cumulative time spent waiting for connections since the process started.
The classic rookie mistake is looking at raw WaitCount values. Because WaitCount grows monotonically from pod startup, a big absolute number tells you nothing on its own. What you actually need is a sliding delta:
package main

import (
    "database/sql"
    "log"
    "time"
)

// MonitorPoolDeltas periodically measures how fast the pool queue is growing
func MonitorPoolDeltas(db *sql.DB, interval time.Duration) {
    ticker := time.NewTicker(interval)
    var lastWaitCount int64
    var lastWaitDuration time.Duration

    for range ticker.C {
        stats := db.Stats()

        deltaWaitCount := stats.WaitCount - lastWaitCount
        deltaWaitDuration := stats.WaitDuration - lastWaitDuration

        lastWaitCount = stats.WaitCount
        lastWaitDuration = stats.WaitDuration

        if deltaWaitCount > 0 {
            avgWait := deltaWaitDuration / time.Duration(deltaWaitCount)
            log.Printf("[ВНИМАНИЕ] Голодание пула: %d горутин ждали слот, среднее ожидание: %v (InUse: %d, Open: %d)",
                deltaWaitCount, avgWait, stats.InUse, stats.OpenConnections)
        }
    }
}
When engineers see WaitCount climbing, their knee-jerk reaction is to bump SetMaxOpenConns from 40 to 500. But if you are running 20 pods in Kubernetes, that suddenly allows up to 10,000 concurrent sessions. PostgreSQL will promptly crash with 'sorry, too many clients already' as backend worker processes exhaust RAM. The real fix is shortening transactions and moving slow work outside database locks.