When automation practitioner Julian Goldie set out to test Anthropic's latest batch of updates, he didn't run synthetic benchmarks. He opened the working folder of a service company called Northside Plumbing on his Mac, where 12 customer plumbing-repair requests had landed from the website. Normally, inquiries like these sit unanswered for hours while a support lead juggles field dispatches and spreadsheets. Launching the new tools, Goldie built an interactive request panel in just over two minutes, spotted two emergency leaks mid-build, and within another three minutes had the terminal watching the customer queue on its own.
Online, people nicknamed this wave of releases "Claude 2.0," though Anthropic never used that official label. Behind the nickname lies a real shift: the AI stops being just a text box and turns into an operating environment with dynamic dashboards, an isolated /btw side chat, mods for the Claude Code console agent, and a presentation editor. How do these features work under the hood, and how can you use them to speed up weekly analytics and parallel coding without losing context?
Live Dashboards Instead of Dead Spreadsheets: How to Query Your Data
At companies without dedicated analysts, an old illusion persists: that tracking sales or support just means exporting a CSV from the CRM once a week and coloring spreadsheet cells by hand. In practice, that report goes stale the minute it's sent, and building a new slice in classic BI tools like Tableau or PowerBI hits the wall of rewriting SQL database queries.
Released in beta, Claude Dashboards (on Pro, Max, Ultra, Team, and Enterprise plans) solves this differently. I double-checked the integrations list in the docs: you connect a warehouse (BigQuery, Snowflake, Amazon Redshift, Databricks, ClickHouse, or Salesforce) or drag an export file straight into chat. There's no need to recall formula syntax—you describe what you want in plain language, and the model writes the SQL query, runs it, and draws live charts in the side panel. Under every chart, you can expand the query code and last-updated timestamp to verify each number yourself.
To keep a panel from turning into a showcase of thirty useless charts, build your prompt from four parts: dashboard title, five headline numbers at the top with week-over-week change, one trend chart, and a plain-language takeaway card. Here's how that pattern works across three scenarios:
- Monday Board: fed 12 weeks of data from a coffee roaster (visitors, orders, new buyers, wholesale bookings, and repeat-purchase rate), the system builds a summary, highlights growth in green and drops in red, plots a 3D order chart, and fills a "Three Big Things This Week" card showing the fastest-growing channel and slipping product. When fresh data arrives, the
Rebuild reportbutton recalculates everything in one click. - Customer Pulse: given a week's stream of emails, chats, reviews, and comments, the dashboard sorts them into questions, praise, and complaints. In the center sits a sentiment sphere of colored particles: green for praise about Kenyan beans and packaging, purple for questions on cold-brew kits and pausing subscriptions, red for complaints. A manager spots four complaints about late deliveries and broken zipper seals and fixes the defect before one-star reviews pile up.
- Content Scoreboard: using stats from 40 YouTube videos (titles, views, and length), the panel builds a podium of the top five performers, identifies winning phrasing and runtime, and suggests three topics for upcoming episodes.
Any chart can be refined by tagging @Claude in a comment, then shared with the team via link or pushed to Amplitude, Grafana, Mixpanel, PostHog, and Sigma. One limit to keep in mind: dashboards are read-only, so you can't edit a number on a chart and write it back to the database yet.
The /btw Side Chat: Parallel Check-Ins Without Stopping Your Terminal Agent
Live analytics saves hours in the browser, but moving to console automation via the Claude Code terminal agent introduces a different bottleneck—dialog lockup during long runs. People assume a console AI works like a single-channel walkie-talkie: while the agent builds a project or edits files, don't touch the terminal or you'll scramble its context.
Back to Northside Plumbing's folder of 12 customer request files. The manager launches Claude Code there and asks it to turn the files into a dark-glass dashboard with live counters, a service-type chart, highlighting for the oldest request, and draft replies. The agent starts reading files and writing code—a build that takes just over two minutes. Right then, a technician calls: they need to know immediately if any emergency jobs are in the queue.
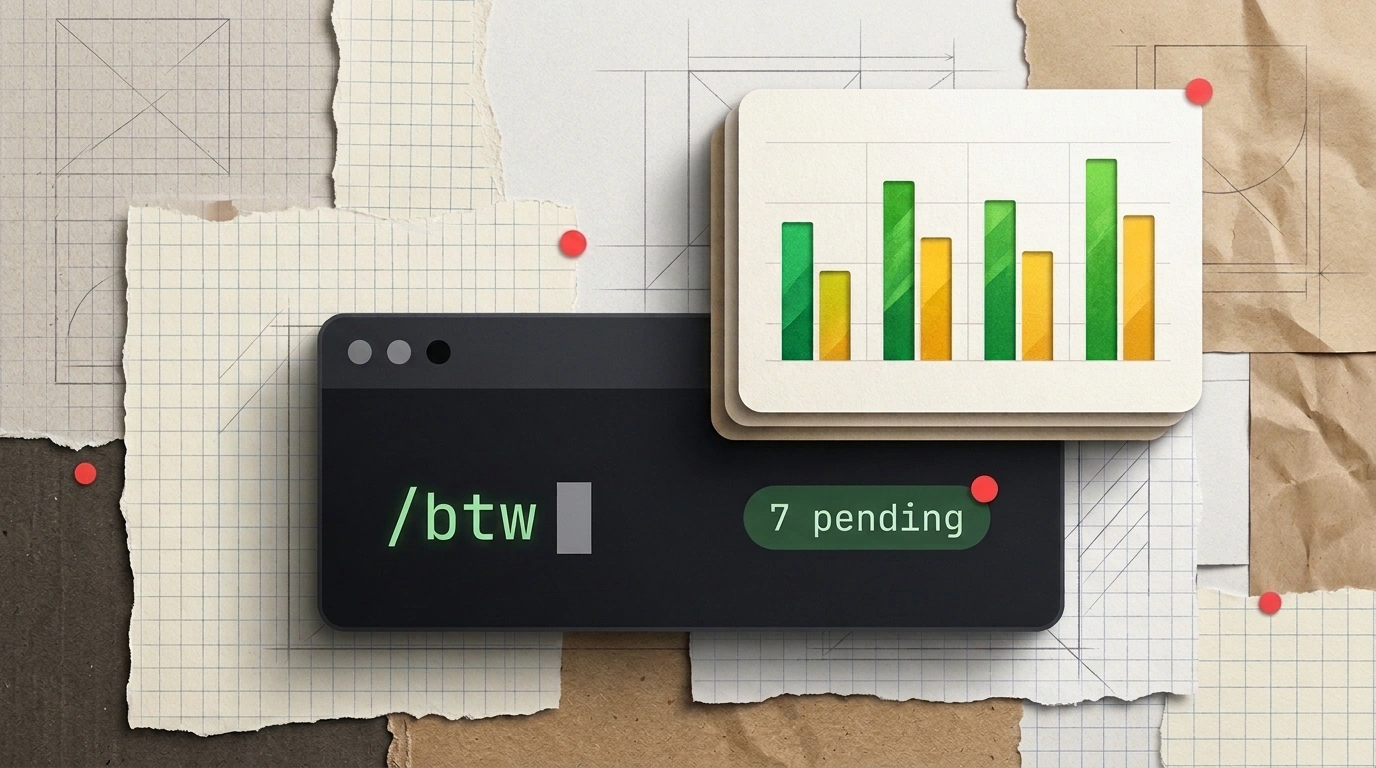
Before, you'd either wait for generation to finish or kill the process. The built-in /btw command (short for by the way) solves this via context branching. Right on top of the running builder, you type in the terminal: /btw which urgent requests haven't received a reply yet?
A helper thread reads the data the main agent already loaded in the session and replies instantly in a side panel: two emergency customers are waiting—Aisha with a burst pipe under her sink and Tom with water leaking through his kitchen ceiling. What stood out to me in this mechanic is how clean the memory stays: the side question never enters the main task stack and doesn't derail the builder. Two minutes later, the main process delivers the finished dashboard: 12 requests, 7 awaiting reply, 2 emergencies, and a Mark Replied button updating counters on the fly. The key rule I'd keep in mind: the side chat only knows what's already loaded in the current conversation, so ask about details after Claude has read the working files.
Custom Mods in Claude Code: Tailoring the Terminal to Your Team's Workflow
Building a dashboard once solves the morning rush, but how do you avoid missing new requests throughout the day? For that, Claude Code gained custom modifications—mods—extending its ecosystem of custom terminal plugins.
Where an ordinary system prompt only changes reply text, a mod reshapes the terminal UI itself: adding a bar above the input line, a side panel, pop-up notifications, and custom slash commands. You don't have to write code by hand: describe the idea in words, and Claude reads the mods documentation, writes the script, runs a test, and installs the extension for the current project.
For the plumbing service, setup took under three minutes. The manager asked for a mod that displays unanswered requests above the prompt line (name, service, and wait time, oldest first), pops a notification when a new file arrives, and adds a /replied command to close the top lead.
After restarting the session, a bar lights up above the cursor showing seven waiting customers. When a new request lands from Ryan, who has had no heat since morning, a notification pops in the terminal and the counter ticks up to eight. Reply to the customer, run /replied, and the oldest ticket from Hannah closes while the queue shifts up.
Docs, Slides, and Motion in the Next Pane: Building Presentations Right in Chat
Once operational tasks are handled, results still need to be packaged for clients or your team. Instead of copying text by hand into external editors, Anthropic opened three visual formats in the artifacts pane across all plans: Docs, Slides, and Design. Any report can be edited alongside the chat together with teammates—for instance, turning rough notes in one sentence into a five-slide sales proposal in brand colors with a clear next step on the final screen.
Rounding out the artifacts editor, three more capabilities joined the ecosystem:
- Chart animation (Claude Motion): a beta feature for Team and Enterprise plans that turns a dashboard or document into a short animated video clip for meetings.
- Cloud streams (Claude Code Projects): splitting a large task into parallel branches in the cloud. During a website update, one stream edits the booking page, a second updates service descriptions, and a third handles the contact form; you shut your laptop and review the finished branches later.
- Ultra plan: a tier for long-running tasks where verified accounts have the 5-hour session cap removed (while keeping the weekly ceiling) so builds don't cut off mid-run.
Taken together, this stack frees you from acting as a courier shuffling numbers from database to spreadsheet to slides. Before opening a blank spreadsheet on Monday or silently waiting out a terminal build, ask yourself: "Am I about to spend half an hour on a manual summary and staring at the console just out of habit, or could one dashboard query and a quick /btw command wrap this up already?"