When Google Chrome Developer Relations engineer Bramus Van Damme was testing the CSS Scroll-Triggered Animations specification, he ran into a familiar problem: an element is already on screen, yet the animation stays silent—or fires long before the reader's eyes reach it. To see the exact moment a threshold was crossed, Bramus had to build custom debug overlays on top of his CodePen demos: drawing blue and green bands and sticking a virtual traffic light in the corner of the screen that flipped from red to green.
Combining those overlays with a Chrome DevTools inspector, he released the Scroll-Triggered Animations Debugger extension and open-sourced it in a GitHub repository. Why does configuring scroll-triggered CSS animations blindly turn into percentage guesswork, and how does this new DevTools panel let you see trigger boundaries and tune timeline-trigger-activation-range and timeline-trigger-active-range on a live page?
Why Configuring Scroll Triggers Blindly Turns into Percentage Guesswork
Let's separate two similar modern CSS mechanisms. In Scroll-Driven Animations, the scrollbar acts like a film scrubbing wheel: nudge the mouse wheel and the frame shifts by the same fraction; lift your finger and the picture freezes (I covered how these timelines replace tracking scripts in an article on pure CSS element intersection detection). Scroll-triggered animations, on the other hand, work like a hallway motion sensor: scrolling only pulls the trigger. As soon as the block crosses the line, the switch clicks—and a regular CSS animation with its own animation-duration plays out on its own.
With that model, it seems like writing a single entry-percentage line in your styles should make the block appear right where the designer intended. Let's put that expectation to the test: we're building a promo page with .feature-card benefit cards and a sticky header (position: sticky; top: 20px). According to the mockup, a card should slide up smoothly once it passes 25% of the viewport height. Guessing blindly, we write timeline-trigger-activation-range: entry 25% entry 100%, refresh the page on a phone—and see the card pop in too early, while its top edge is still hidden behind the sticky header.
Without visible guide lines, styling triggers feels like shooting blindfolded.
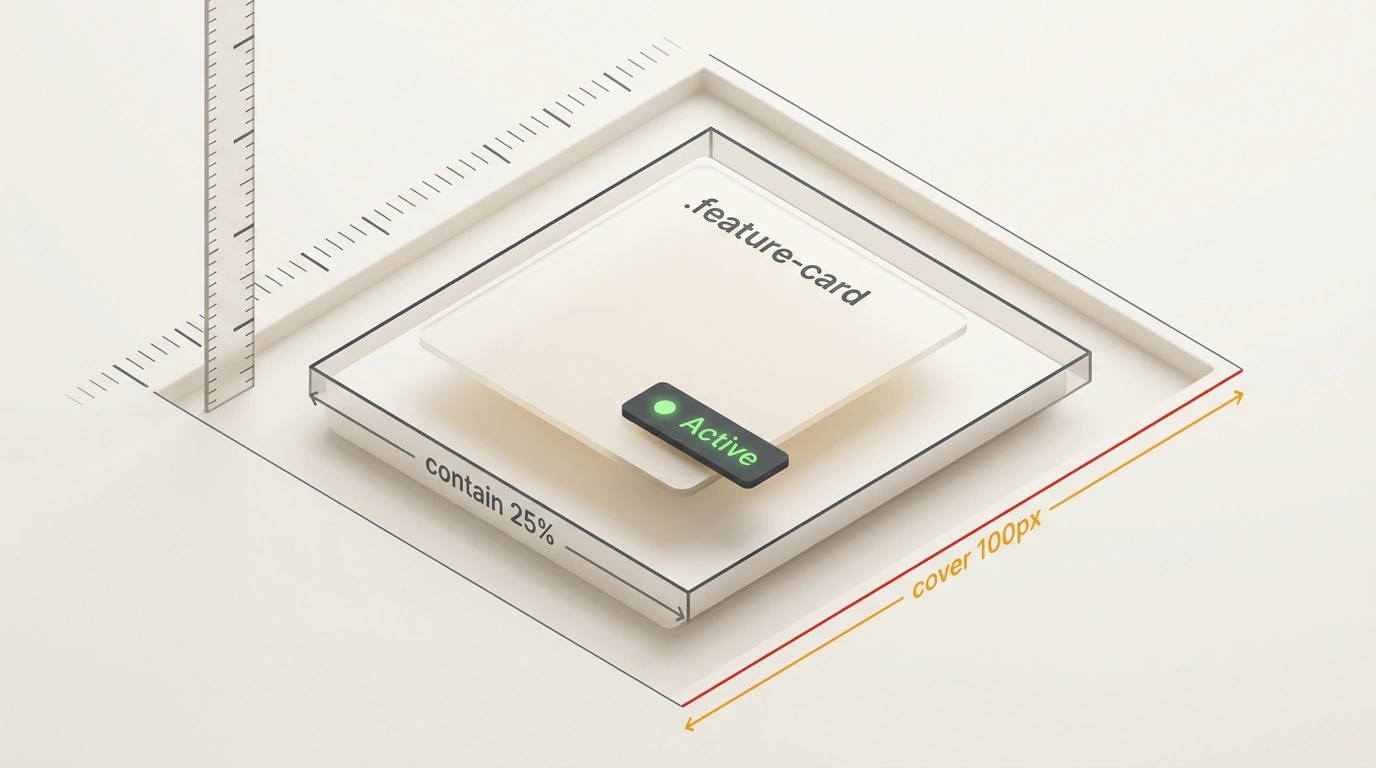
The browser calculates element phases (entry, contain, cover, exit) using the container and DOM node boxes, ignoring header overlap. On top of that, a trigger has two corridors: the activation range timeline-trigger-activation-range, which starts play-forwards, and the outer active range timeline-trigger-active-range, outside of which the trigger resets to play-backwards. When you have to keep both boxes in your head, any padding tweak forces you to guess percentages again and reload the tab.
Trial-and-error number picking in CSS wastes hours where seeing the layout once on screen would be enough.
Interactive Minimap and Colored Activation Boundaries Inside the Elements Panel
What caught my eye most in this tool is how cleanly the extension surfaces hidden geometry right inside the Elements tab in Chrome DevTools. In Chromium-based browsers, you need to enable the chrome://flags/#enable-experimental-web-platform-features flag or launch with --enable-blink-features=ScrollTriggeredAnimations, then install the extension from the Chrome Web Store or load the folder from the repo via chrome://extensions. Press F12 to open DevTools, select $0, and open the Scroll-Triggered Animations pane next to Styles—the inspector breaks the mechanics down into three instruments.
The first instrument is the interactive Minimap. It draws a live diagram of the scroller scroll container, element, and subject, moving in sync with scrolling. The panel supports ScrollTimeline via scroll(), ViewTimeline via view(), and properly accounts for position: sticky elements.
The minimap shows the relative position of the container, block, and trigger boundaries in real time.
The second instrument is the state indicator light. While the card is below the launch threshold, the indicator glows red with an Inactive status; once it crosses the calculated line, it switches to green Active.
The third guide is the two-color boundary overlay on top of the layout:
- Blue lines and boxes show
timeline-trigger-activation-range—the launch corridor whose crossing activates the trigger. - Green lines and boxes outline
timeline-trigger-active-range—the outer retention corridor inside which the card won't reset from slight touchpad jitter, reverting to its initial state only when scrolled back past the green line.
On our landing page with .feature-card and the sticky header, the blue lines in DevTools immediately reveal why the entry phase was firing Active too early, so we switch the rule to the full-entry contain phase with a cover safety buffer:
@keyframes fadeInUp {
  from { opacity: 0; transform: translateY(40px); }
  to { opacity: 1; transform: translateY(0); }
}

.feature-card {
  view-timeline: --card-timeline block;
  animation: fadeInUp 0.6s ease-out forwards;
  timeline-trigger: --card-timeline;
  timeline-trigger-activation-range: contain 25% contain 75%;
  timeline-trigger-active-range: cover 100px cover calc(100% - 100px);
}
After switching to these rules, the page behavior settles into place. view-timeline: --card-timeline block ties progress tracking to the card's movement, while timeline-trigger-activation-range: contain 25% contain 75% raises the blue launch line above the bottom edge of the viewport. The DevTools indicator turns green, and the 0.6s fadeInUp transition with a 40px shift starts right when the entire card has entered 25% of the viewport height and cleared the sticky header.
The line timeline-trigger-active-range: cover 100px cover calc(100% - 100px) wraps the card in a green buffer. While the reader inspects the block and nudges the page slightly, the card stays inside the green corridor without flickering, resetting only when scrolling back to the top of the section.
Live Range Editing and Browser Architectural Limits
Another detail I noticed right away in the tool's architecture saves a ton of repetitive back-and-forth: to dial in contain 25% and cover 100px, you don't need to jump back to your code editor after every attempt. At the bottom of the pane are Start and End inputs for both ranges, including a mirrored toggle. Change a phase or offset directly in the inspector and the colored lines on the page update without reloading the tab—then just copy the numbers into your CSS. The extension runs locally within the tab context with no network requests or telemetry.
You might expect such a visual editor to display any CSS unit and work on every site. In practice, however, the tool runs into two limitations of the browser platform itself (you can compare this with debugging classic scroll timelines in our roundup of web developer tools for scroll animations).
The first limitation involves relative units. If you set a viewport height like 90vh or 25svh, the DevTools editor fields show recalculated pixels, such as 240px. The reason lies in DOM standards: neither the Animation object nor getComputedStyle($element) exposes the author's original specified styles, resolving them to pixels instead. A request for an API to read specified values is being discussed by the W3C working group in w3c/csswg-drafts#10002.
The browser only exposes final pixel values to the inspector, hiding the original relative units.
The second limitation shows up in sandboxes like CodePen. In standard Editor View, the pane throws "Could not read the required data from the element." or reports no triggers found. The culprit is a Chrome DevTools bug (crbug/1480418): when querying $0 via chrome.devtools.inspectedWindow.eval inside an iframe, the browser returns undefined or a node outside the frame. The workaround is switching the sandbox to Standalone Debug View at /debug/ without the iframe wrapper.
Sandboxes using iframe block reading the $0 node, so you need to debug demos in direct Debug View.
There is no universal "perfect percentage" recipe that works identically on a desktop monitor and on a smartphone under a sticky header—and the spec itself still lives behind an experimental flag while waiting for the panel to ship in Chrome DevTools by default. Still, with the minimap and colored range lines, you no longer have to guess blindly: you see each trigger's physical boundaries right over the layout and understand the exact rules the browser uses to fire the animation.