Anyone who has ever set up end-to-end or component tests in a real browser knows this specific brand of helplessness. Your CI pipeline turns an alarming shade of red. You dig into the build artifacts, open the screenshot captured when the test failed, and see... a completely blank page or a closed modal.
By the time the assertion threw a timeout error, the UI had already moved on: an animation finished, a toast notification faded away, or the form reset itself. So you end up running the test locally, dropping in artificial await sleep(5000) pauses, and frantically scattering debugger breakpoints just to catch a fleeting state.
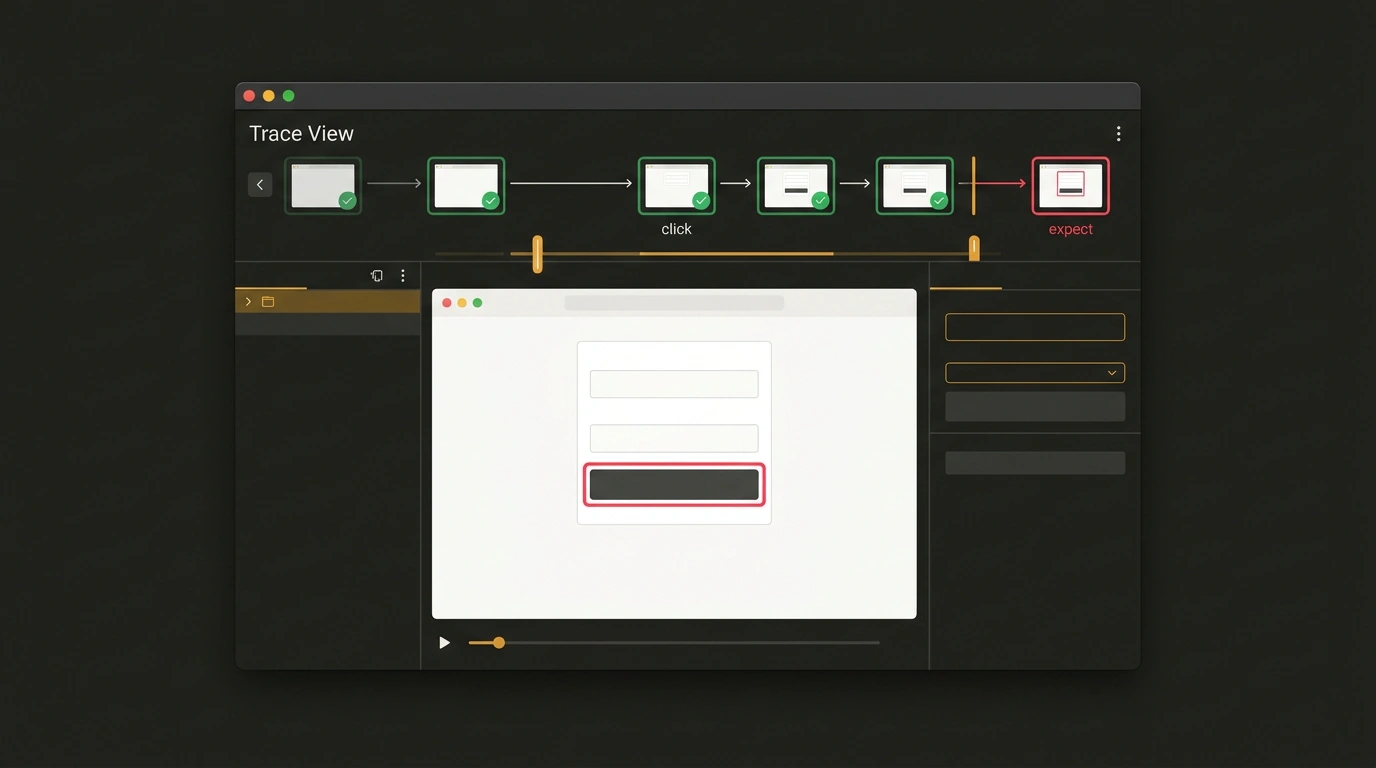
In the major Vitest 5 release, the team dealt a decisive blow to that workflow. Browser Mode now ships with an interactive, step-by-step debugging tool called Trace View.
Earlier, we tracked how Vite and VoidZero ecosystem tools are unifying bundling and testing into a single fast pipeline. Vitest 5's new tracing mechanism brings that same clarity and predictability to browser test debugging.
DOM Serialization Instead of Heavy Video
The core engineering idea behind Trace View is ditching bulky continuous video streams and isolated post-mortem screenshots. Instead, Vitest continuously captures digital snapshots of the DOM tree:
- On every user action (button click, text input, hover);
- On every assertion call (
expect(...)); - On every manual checkpoint you drop in with
page.mark().
These snapshots are lightweight serialized DOM structures, compressed and stored in chronological order. What you get is a genuine time machine for your test: click any step on the timeline and see the exact page state the browser saw down to the millisecond.
Where Interactive Inspection Works
You don't need to install heavy standalone apps. Trace inspection is built right into the environments you already use:
- Directly in the browser: when running tests locally with an open browser window, the Trace View panel sits right alongside your component under test.
- In Vitest UI: a clean timeline lets you step forward and backward using your keyboard arrow keys.
- In the official VS Code extension: clicking a failed step in the test panel immediately highlights the offending line in your editor.
- In standalone static HTML reports: your CI server can generate a single self-contained HTML artifact. Any QA engineer or developer can open it locally in a browser without spinning up the dev environment or rebuilding the project.
When you jump to a step, the failing element is highlighted with a bright contrasting outline, and the call stack shows exactly which expectation failed.
// vitest.config.ts — enabling Trace View in Browser Mode
import { defineConfig } from 'vitest/config';

export default defineConfig({
  test: {
    browser: {
      enabled: true,
      name: 'chromium',
      provider: 'playwright', // or 'webdriverio'
      traceView: true,
      headless: true,
    },
  },
});
A huge win in Vitest's implementation is complete independence from the underlying browser driver. It works identically on top of Playwright, WebDriverIO, or preview providers—no vendor-specific CLI tools required.
// tests/checkout.test.ts — sample scenario with step capture
import { test, expect } from 'vitest';
import { page } from '@vitest/browser/context';

test('оформление заказа с валидацией промокода', async () => {
  const promoInput = page.getByRole('textbox', { name: 'Промокод' });
  await promoInput.fill('SALE2026');

  const applyBtn = page.getByRole('button', { name: 'Применить' });
  await applyBtn.click();

  // On failure, Trace View shows the exact DOM state at the moment of the click
  const discountLabel = page.getByTestId('discount-amount');
  await expect.element(discountLabel).toHaveText('-20%');
});
Step-by-step DOM snapshot recording inevitably uses extra RAM. In large monorepos running thousands of tests in CI/CD, set traceView: 'on-failure' so traces are only saved for failing scenarios instead of bloating your build artifacts.
Practical Takeaway
Trace View in Vitest 5 moves browser test debugging out of the dark ages of console.log guesswork and into precise engineering diagnostics. Being able to reconstruct a failure's exact context in two clicks straight from a CI report saves hours of chasing ghosts, letting frontend teams focus on shipping reliable interfaces.