Every frontend developer knows the golden rule of performance: "Get heavy computation off the main thread!" Whenever you need to filter an array of a hundred thousand products, parse a massive Excel spreadsheet, or process an image on Canvas, you spin up a Web Worker and happily offload the work to a background thread.
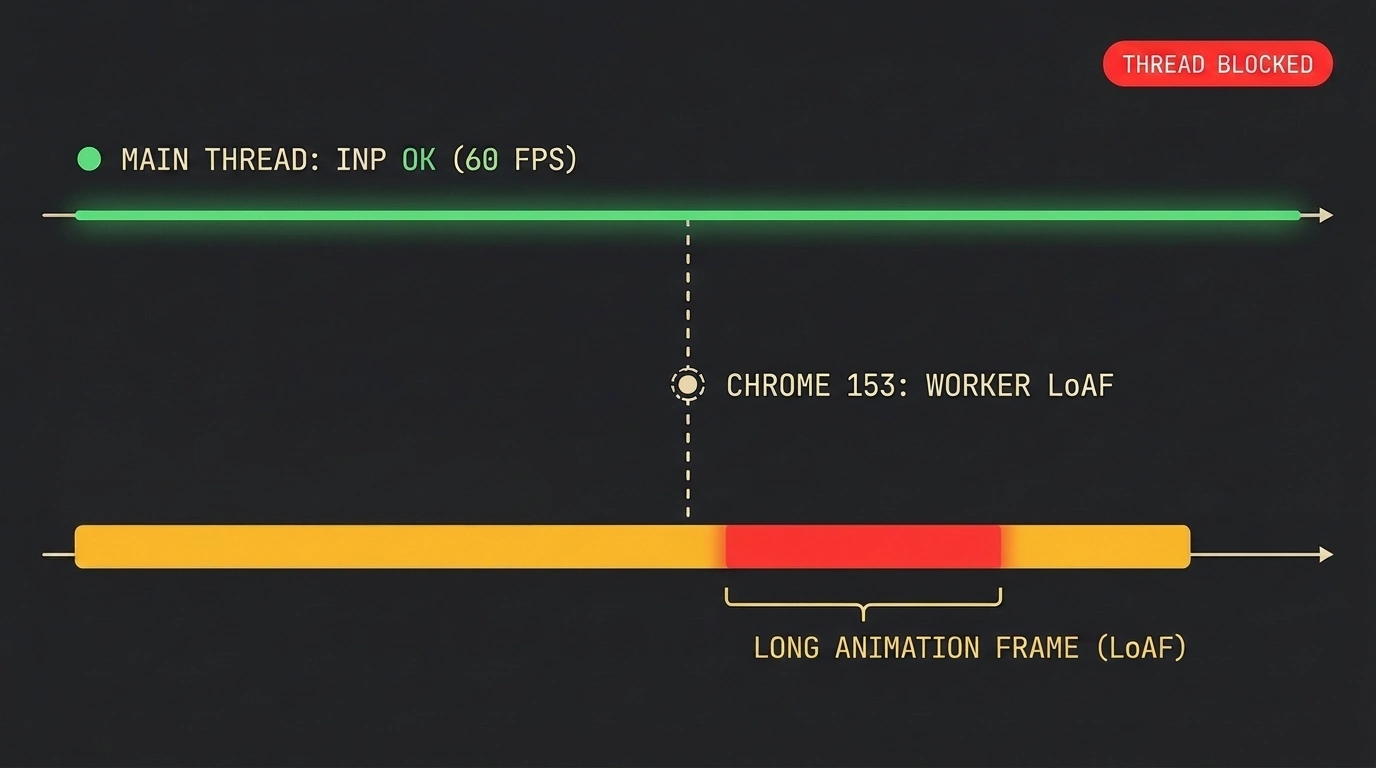
From the browser engine's perspective, everything looks spotless: the Main Thread is free, the UI doesn't freeze, scrolling stays locked at 60 fps, and your core responsiveness metric—INP (Interaction to Next Paint)—glows bright green on every dashboard.
Yet what does the actual person sitting in front of the screen see? They click a filter or generate a report and stare at an endless spinner. Technically the page isn't frozen, yet the app isn't responding either, because the worker's own event loop has ground to a halt under the weight of calculations. Until recently, teams had no native way to gather objective RUM telemetry from workers: they remained a complete black box.
That blind spot is now closing thanks to the Long Animation Frames API in Chrome 153, which extends coverage into DedicatedWorkerGlobalScope.
How to Run PerformanceObserver Inside a Web Worker
Even though a worker has no concept of "frame painting" or DOM reflows, the browser reuses the LoAF specification's semantics to measure long blocking tasks inside the background event loop.
You can now initialize a standard PerformanceObserver directly inside your worker script:
// telemetry-worker.js
if (typeof PerformanceObserver !== 'undefined' &&
    PerformanceObserver.supportedEntryTypes.includes('long-animation-frame')) {

  const observer = new PerformanceObserver((list) => {
    for (const entry of list.getEntries()) {
      // Forward blocking telemetry back to the main thread
      self.postMessage({
        type: 'PERF_TELEMETRY_LOAF',
        payload: {
          duration: entry.duration,
          startTime: entry.startTime,
          scripts: entry.scripts.map((script) => ({
            invoker: script.invoker,
            sourceURL: script.sourceURL,
            executionDuration: script.executionDuration,
          })),
        },
      });
    }
  });

  observer.observe({ type: 'long-animation-frame', buffered: true });
}
On the main thread, all that's left is listening for incoming messages and shipping them to your analytics pipeline:
// main.js
const worker = new Worker('/telemetry-worker.js');

worker.onmessage = (event) => {
  if (event.data?.type === 'PERF_TELEMETRY_LOAF') {
    const { duration, scripts } = event.data.payload;
    console.warn(`[Worker LoAF] Worker blocked for ${duration} ms:`, scripts);
    // Send to your RUM system (Datadog, Sentry, or custom analytics)
  }
};
Architectural Nuances and Implementation Limits
When wiring up this monitoring, keep three runtime specifics in mind:
- Context isolation: an observer created in
windowcannot see worker events! The observer must be instantiated inside the worker itself. - Tying delays back to user clicks: to know which exact user click stalled the worker, pass a
correlationIdalong with each task and attach it to yourPerformanceObserverreports. - First-version limitation: as performance specialist Harry Roberts points out on CSS Wizardry, the current implementation catches a single continuous long task. It still misses a traffic jam made of hundreds of tiny 5-millisecond microtasks that collectively add up to several seconds of delay.
This API turns Web Workers from a dark room into an observable pipeline. If you're into deep web app diagnostics, check out our practical guide to the Performance panel in Chrome DevTools.