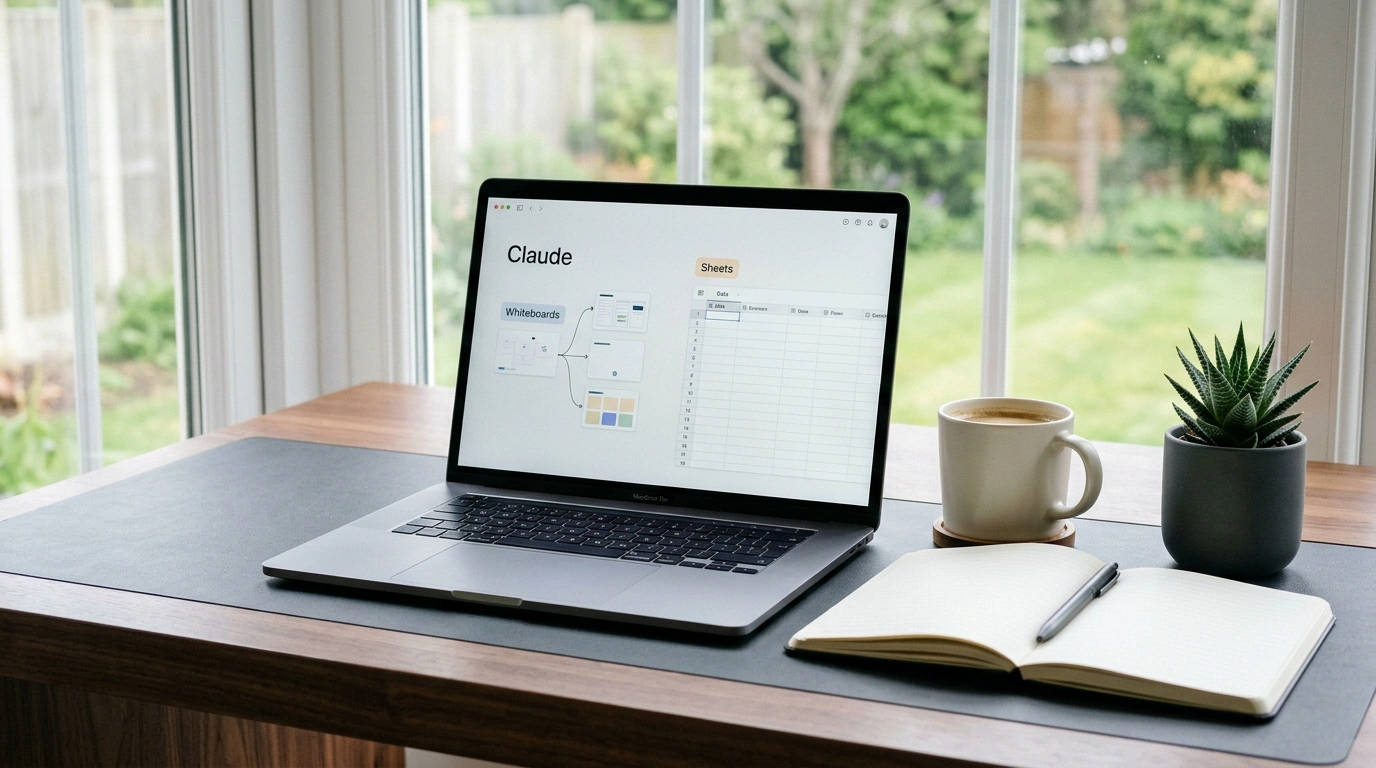
Two beta tools just landed in Claude's Artifacts panel across all paid plans—no $100 or $200 tier required: Claude Whiteboards and Claude Sheets. At the same time, the analytics module Claude Data (formerly Dashboards) hit General Availability. In this breakdown, I want to answer a practical question: should you actually move your diagrams and reports out of Google Sheets and Miro into Claude's built-in workspace, where do these canvases save real time, and where will you immediately hit beta walls?
From Linear Chat to a Continuous Workspace
A standard chat turns data analysis into tab-ping-pong: to dissect a sales report or sketch a budget, you copy answers out to external spreadsheets and diagramming apps, then manually rewrite cells and arrows every time a number shifts.
In Anthropic's official blog post, the team tackles this with context continuity. Earlier, a unified canvas for documents and slides brought text editing into the side panel; now three modes round out the workspace:
- Claude Whiteboards (beta) — a canvas that turns rough notes into flowcharts, process maps, and task lists with deadlines;
- Claude Sheets (beta) — dynamic spreadsheets with tabs, formulas, and dropdown lists;
- Claude Data (General Availability) — interactive dashboards and data stories with direct connectors to Snowflake, BigQuery, and Salesforce.
Igor Pogany from The AI Advantage put the update through its paces on a gym case study (Desert Strength), using a 6-month P&L report and a $300 budget to launch a free trial workout. Let's see how all three tools hold up across that scenario and a sales funnel audit.
Interactive Whiteboards: Process Maps, Funnels, and Mind Maps
Drop rough launch notes or sales funnel stages into chat, and Claude Whiteboards lays them out on a canvas as connected cards plus a checklist with dates and owners (in testing, it mapped a coffee bean's journey from farm to cup just as smoothly). Both you and the assistant can drag cards around and rewire connections.
One detail from the test really stood out to me: when the trial workout budget was tweaked at $300, a single follow-up message in chat made Claude automatically recalculate and update the entire flowchart and checklist. In Miro or Whimsical, you rarely ask an AI to build a diagram from scratch—it's usually faster to jot down text. Having the canvas live inside the conversation removes the friction between a raw idea and a process map before you ever touch slides.
Dynamic Sheets: Formulas and Filtering vs. Google Sheets
Next, the sales and expense report goes into Claude Sheets (with import buttons for Google Sheets and Excel). Inside the side panel, Claude builds tabs, dropdowns, and formulas for funnel conversion or hiring plans, tracks edits, and exports to .xlsx and .csv.
A head-to-head comparison with Google Sheets quickly brings things down to earth, though. The Claude Sheets beta has no pivot tables, macros, or protected ranges, and sharing with teammates requires a Claude account, a Teams plan, or a public link. When Igor Pogany's team ran the exact same 6-month report inside Google Sheets using Claude's Google Workspace extension, the sidebar bot built the plan and populated the cells just as well. There's no reason to migrate your company's core databases into Claude—built-in Sheets shines as a scratchpad for testing hypotheses and spotting anomalies right inside a chat.
Combining Text, Diagrams, and Claude Data: Anomaly Detection and Data Stories
The real payoff comes from chaining all three modes together. Upload a sales report, map the funnel on a Whiteboard, use Sheets formulas to pinpoint a conversion drop at the demo stage, and then hand the numbers to Claude Data to generate a dashboard and a 15-second data story—a slide-style tab explaining where revenue is leaking.
We've already looked at how dynamic dashboards in Claude's ecosystem handle exports. Keep one quirk from testing in mind: when generating data stories about revenue dips, the builder occasionally drops part of your instructions on the first pass, so you'll need a follow-up prompt to close that blind spot. Still, unlike ChatGPT Spaces at $100, Whiteboards is unlocked on the entry paid tier.
Don't haul your team's pivot-heavy workbooks into Claude. Pick one messy problem—meeting notes or a CSV sales export—open Whiteboard in Artifacts, ask for a funnel flowchart with a checklist, and then change the budget or deadline in chat to watch the whole map adapt on the fly.