Open your monitoring dashboard during a traffic spike, and you'll see a picture that can baffle any engineer. The charts look calm: Kubernetes' built-in Horizontal Pod Autoscaler (HPA) is watching the cluster, average CPU utilization sits around 70%, and resource allocation rules are being followed. Yet at that exact moment, people trying to open your site or app are hitting a wall of 503 Service Unavailable and 504 Gateway Timeout errors. Two incompatible realities exist side by side: according to the orchestrator's reports, scaling is going according to plan, while for a live user, the service is down.
What caught my eye in a breakdown from the DevOps&SRE Library channel was how cleanly it explained this mismatch. The original post is by distributed systems researcher David Morrison (drmorr) at Applied Computing Research Labs (ACRL). In the second part of a series on five Kubernetes autoscaling metrics (following his colleague Ian's piece on calculating money burned on idle nodes), Morrison proposed looking at reliability through the customer's eyes and introduced MTSS (Mean Time to Stop Sucking). Let's unpack why autoscalers arrive late to a traffic spike, how to measure the actual degradation window, and which HPA and KEDA settings shrink it.
The Lagging Metrics Trap and the Pod Startup Blind Spot
Autoscaling comes down to a balance between cost and reliability, which Morrison compares to flipping a coin: "heads it's cheap, tails it doesn't break." Making infrastructure cheap is easy—just turn off the servers. Making it bulletproof is easy too: give every pod a massive c7i.48xlarge instance, though your CFO won't be thrilled with the bill. What we actually need is to scale up under load without dropping quality, and scale back down without snapping active client sessions.
Why does CPU- and memory-based autoscaling lag when traffic surges? Let's trace the end-to-end scenario from Applied Computing's analysis. A wave of requests hits a web service. Average CPU utilization sits at 70%, yet the incoming HTTP request queue overflows almost instantly. Even if the cluster nodes have spare capacity and only need to spin up 4 new pods, users suffer a 45-second burst of 504 Gateway Timeout errors. First, the metrics collector averages container stats; then the HPA controller runs its check loop (every 15 seconds by default) and, once the 70–80% threshold is crossed, creates 4 replicas. While those containers initialize their runtime, connect to the database, and pass their readiness probe, the existing pods keep timing out requests.
When there's no room left on existing servers, that delay balloons to tens of minutes. Morrison gives a telling chain of events: 2 pods on a single t3.medium node serve a project's homepage, and a link hits the front page of a popular portal. The pods choke, throwing millions of 503 Service Unavailable errors. HPA creates new replicas, but they stay stuck in Pending because the t3.medium node is full. The autoscaler requests machines from the cloud provider (for scarce GPU instances, waiting alone can take 10 minutes). Next, 5+ minutes go into node preparation: installing OS updates and configuring the environment (prod or staging) before kubelet even starts. And once the pod finally launches, a Java service spends another 5 minutes warming up the JIT compiler and loading caches into memory.
What Makes Up the MTSS Failure Window Along the Request Path
Most teams only track an internal scheduler metric—a pod moving from Pending to Scheduled. In the Karpenter node provisioner, there is an alpha metric karpenter_pods_unbound_time_seconds that records how long it takes from pod creation to node binding. But that only reflects how fast the cloud hands over a VM—a small fraction of what the user actually cares about.
Picture a supermarket at rush hour with a line stretching to the door at the single open checkout. Measuring autoscaling with karpenter_pods_unbound_time_seconds is like timing how many seconds it took the manager to assign four cashiers to four empty registers. On paper, the staffing happened in half a minute! But for the shopper, the lane is still closed: the cashier has to boot the terminal, load the POS software, and feed the receipt tape. Until the green light turns on above the lane and the scanner beeps on the first item, the line doesn't move.
The MTSS metric starts the stopwatch from the shopper's side. It measures the interval from the moment service quality drops below the target SLO (Service Level Objective—the acceptable threshold for 5xx errors and latency inside an SLA) to the second new pods pass their readiness probe and bring numbers back to normal. Frontend metrics like First Contentful Paint or Mean Time to First Byte won't help here: not every service returns bytes to a browser, and client-side scripts can't see where the cluster got stuck.
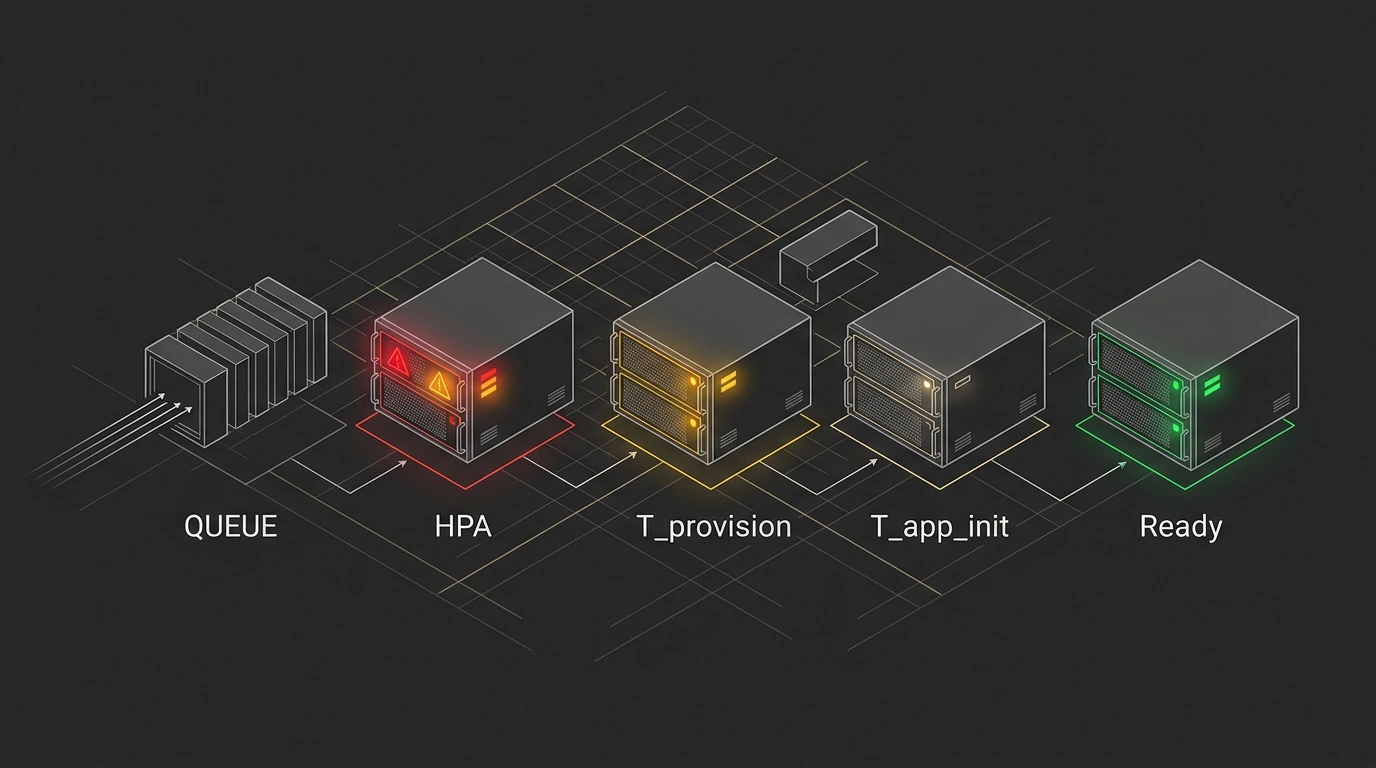
Mathematically, the MTSS window is the sum of six delays:
MTSS = T_detect + T_provision + T_node_prep + T_pull + T_app_init + T_readiness
T_detect— spike detection by the metrics collector and HPA polling loop (15 seconds);T_provision— cloud VM provisioning (AWS, GCP, or Azure);T_node_prep— OS patching, node configuration, andkubeletstartup;T_pull— pulling container images from the registry;T_app_init— startinginitcontainers, sidecars, and warming up the runtime;T_readiness— passing thereadiness probe, opening the pod to traffic.
Adding those six segments together turns into either 45 seconds of 504 Gateway Timeout errors when 4 pods start on ready nodes, or a 15-minute outage during a cold node order.
Engineering Levers to Speed Up HPA and KEDA—and Their Limits
Understanding every link in the MTSS chain gives a platform team concrete levers to cut response times:
- Fast node provisioning and pre-baked AMIs. Replacing Kubernetes Cluster Autoscaler with Karpenter (supporting AWS, Azure, and GCP) speeds up VM allocation
T_provision. And to eliminate the 5-minuteT_node_preppause, bake OS updates and configurations into the machine image ahead of time. - Shorter polling loops and leading metrics in KEDA. As Morrison jokes, everyone knows you shouldn't scale on CPU, and everyone keeps scaling on CPU anyway. Moving to the event-driven autoscaler KEDA (previously essential for scale-to-zero, though HPA recently gained that capability too) lets you tighten metric polling, tune
behavior.scaleUp.stabilizationWindowSeconds, and tie scaling to leading signals: HTTP request queue depth, incoming RPS, or broker lag. Earlier, we looked at five leading Kubernetes metrics from ACRL and calculating lag thresholds before triggering KEDA. - Scaling service chains together and trimming pod startup. In an
A → B → C → Dchain, sequential scaling is useless: as soon asAscales up, the flood of requests knocks overB, thenCandD, and errors don't clear untilDis up. The right move is to scale the entireA → B → C → Dchain simultaneously when load onArises. And to shrinkT_app_initwithout touching application code, cut down heavyinitcontainers and sidecar proxies (if you have fewer than ten, you're already ahead of most enterprise clusters).
Compare the time a pod binds to a node (karpenter_pods_unbound_time_seconds) against the moment it enters the Ready state. The gap reveals how long image pulls, sidecar startup, and app warmup (T_pull + T_app_init + T_readiness) actually take.
At the same time, these tools come with strict caveats and trade-offs:
- The cost of end-to-end tracing. A single aggregate MTSS number tells you there's a problem, not who caused it. To break the delay down by stage, you have to correlate five sources (request arrival via service mesh, node metrics, HPA decision, node provisioner response, and app startup) using distributed tracing, which drives up telemetry costs.
- The predictive autoscaling myth. Many teams try to sidestep cold-start optimization by rolling out a predictive autoscaler. It sounds impressive (and almost guarantees the author a promotion, even if the system never works), but sudden traffic spikes are notoriously hard to forecast, and with 10-minute node and Java pod startups, any prediction miss still causes an outage. Predictive algorithms only work on cyclical workloads through proven vendors—they never replace fast pod startup.
The takeaway is straightforward: stop judging autoscaling by 70% CPU graphs and pod-to-node binding speed. Measure the end-to-end window of 504 and 503 errors until readiness probe passes, switch HPA and KEDA to request queue depth, pre-bake updates into node images, and strip out extra sidecars. None of this engineering is for pretty numbers in a report: good infrastructure should stay invisible to the person on the other side of the screen, so that during a sudden surge, the page opens instantly and the team stays calm and confident in its architecture.