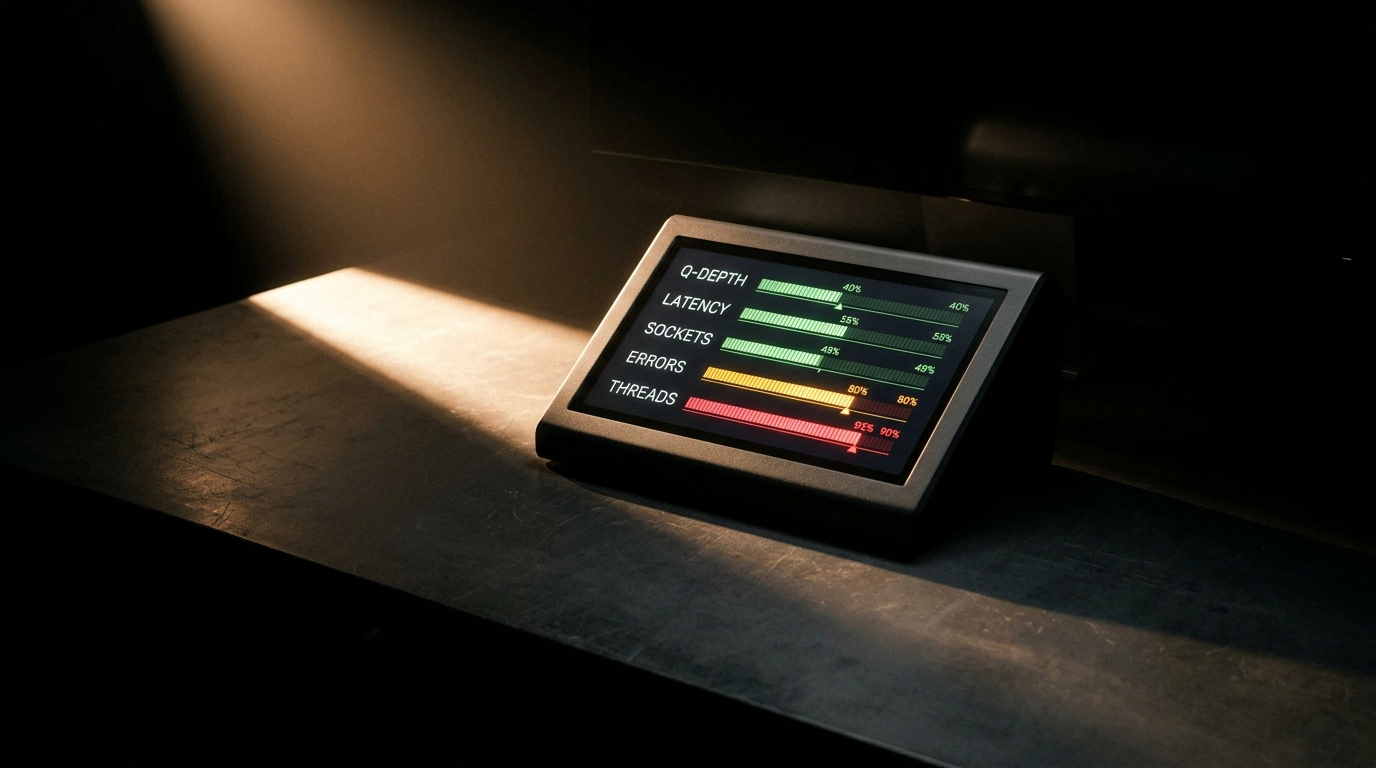
Ask almost any sysadmin or DevOps engineer how their Horizontal Pod Autoscaler (HPA) is configured in Kubernetes, and nine times out of ten you'll hear the same automatic answer: "CPU and memory utilization—the classic 70–80% threshold."
On paper, that sounds completely sensible: traffic spikes, CPUs heat up, Kubernetes notices the utilization jump and spins up five more replicas. In real high-load production, though, that naive setup routinely triggers cascading outages. By the time a container's CPU hits 90%, it's usually too late to save the service: the incoming request queue is already overflowing, timeouts are piling up, and brand-new pods still need two or three minutes to initialize, pull images, and pass readiness probes. Meanwhile, load shifts onto the remaining healthy pods and the cluster topples like dominoes.
Engineers at Applied Computing Research Labs (ACRL) published a detailed analysis of scaling bottlenecks, breaking down five non-obvious metrics that let you trigger predictive autoscaling long before CPUs peg at 100%.
Why CPU and Memory Mislead Your Autoscaler
Let's look at the physics of the problem. CPU and RAM utilization are lagging indicators—they tell you a disaster has already happened, not that one is brewing.
Even worse, in modern asynchronous microservices built on Node.js, Go, or Java, CPU usage can sit at a calm 30% while the service is effectively dead to users. Suppose your PostgreSQL connection pool is exhausted, or an upstream payment gateway starts taking 5 seconds to respond. Incoming application threads block on I/O wait, leaving the CPU idle. Kubernetes glances at 25% CPU utilization and assumes everything is fine, even as users get hammered with HTTP 504 Gateway Timeout errors.
The ACRL researchers identified five foundational metrics centered on throughput and queue depth.
The Five Key ACRL Metrics: Leading Load Signals
- Queue Ingestion Rate vs. Processing Rate: For async workers (RabbitMQ, Kafka, SQS), watching CPU is pointless. What matters isn't the raw queue length, but its derivative: the rate of incoming messages minus the rate of processed messages. The moment that delta turns positive, scale out immediately.
- Queue Dwell Time: Measures how many milliseconds a message or HTTP request sits waiting in a buffer before a free thread starts executing it. Crossing a 200–300 ms threshold is a direct signal to add pods.
- TCP Handshake Latency and RTT: Measured at the Ingress load balancer. A spike in TCP connection setup time indicates the OS socket backlog (
somaxconn) inside the pod is overflowing. - Pool Saturation Ratio: The ratio of active execution threads to total worker pool capacity. Once a pool hits 85% saturation, the service has almost no headroom left for sudden traffic bursts.
- Ingress p99 Latency: The response time of your slowest 1% of requests flags degradation well before median (p50) latency starts to budge.
If you're designing stress tests to calibrate these thresholds, take a look at our guide to realistic Kubernetes load testing with k6 for microservices, which shows how to pinpoint those breaking points empirically.
Practical KEDA and HPA Configuration
Standard Kubernetes resources aren't enough to scale on leading indicators—you'll need KEDA (Kubernetes Event-driven Autoscaling) or a custom metrics pipeline via Prometheus Adapter.
Here is a production-ready KEDA ScaledObject manifest that tracks Kafka queue lag growth and buffer dwell time:
apiVersion: keda.sh/v1alpha1
kind: ScaledObject
metadata:
  name: order-processor-autoscaler
  namespace: production
spec:
  scaleTargetRef:
    apiVersion: apps/v1
    kind: Deployment
    name: order-processor
  minReplicaCount: 3
  maxReplicaCount: 30
  cooldownPeriod: 300
  pollingInterval: 15
  advanced:
    horizontalPodAutoscalerConfig:
      behavior:
        scaleUp:
          stabilizationWindowSeconds: 0
          policies:
            - type: Percent
              value: 100
              periodSeconds: 15
        scaleDown:
          stabilizationWindowSeconds: 300
          policies:
            - type: Percent
              value: 10
              periodSeconds: 60
  triggers:
    - type: kafka
      metadata:
        bootstrapServers: kafka-cluster:9092
        topic: orders.v1
        consumerGroup: order-workers
        lagThreshold: "50"
        activationLagThreshold: "10"
And here is a standard HPA configuration wired to external Ingress latency metrics from Prometheus, complete with anti-flapping protection:
apiVersion: autoscaling/v2
kind: HorizontalPodAutoscaler
metadata:
  name: api-gateway-hpa
  namespace: production
spec:
  scaleTargetRef:
    apiVersion: apps/v1
    kind: Deployment
    name: api-gateway
  minReplicas: 4
  maxReplicas: 40
  metrics:
    - type: External
      external:
        metric:
          name: ingress_request_duration_p99_seconds
          selector:
            matchLabels:
              service: api-gateway
        target:
          type: Value
          averageValue: 250m
  behavior:
    scaleUp:
      stabilizationWindowSeconds: 0
      policies:
        - type: Pods
          value: 4
          periodSeconds: 15
    scaleDown:
      stabilizationWindowSeconds: 300
Pay close attention to the behavior block: on scale-up, the stabilization window is zeroed out for an instant reaction to traffic spikes, while scale-down enforces a five-minute window (stabilizationWindowSeconds: 300). That keeps the cluster from thrashing—endlessly spinning pods up and tearing them down during sawtooth traffic.
Moving to predictive metrics takes some up-front Prometheus tuning, but it pays for itself the very first time a flash sale or traffic surge hits.