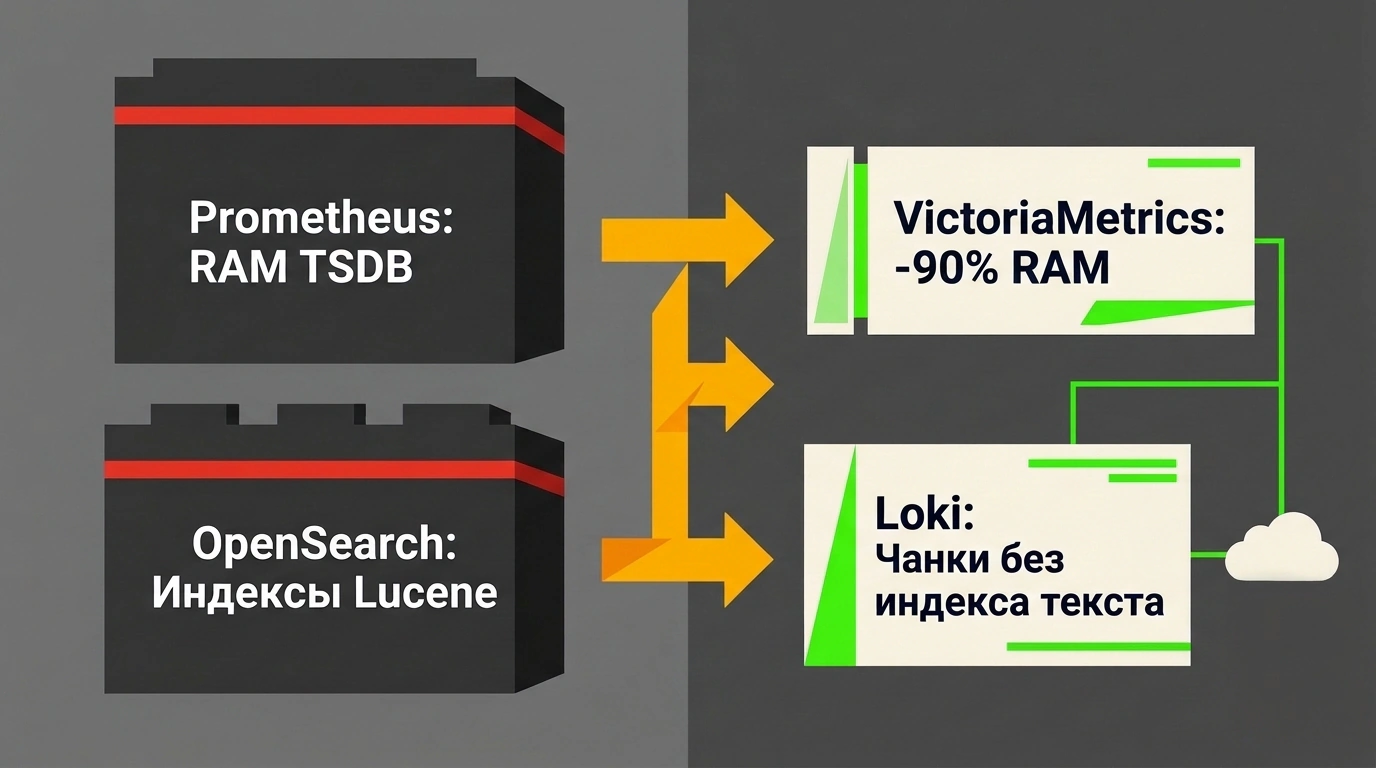
As a microservice architecture grows, every infrastructure engineer eventually hits the observability scaling wall. The traditional cloud-native gold standard—pairing Prometheus for time-series metrics with OpenSearch for logs—starts showing cracks the moment it meets dynamic Kubernetes clusters.
Constant pod restarts, ephemeral IP addresses, and high-cardinality user labels trigger a cardinality explosion. Prometheus runs out of memory on a single node, while OpenSearch balloons disk arrays with terabytes of inverted indexes.
A practical engineering breakdown from DevOps by REBRAIN puts the classics head-to-head against lightweight alternatives: VictoriaMetrics and Grafana Loki. Let's look at the real trade-offs.
Metrics Battle: Prometheus vs. VictoriaMetrics
Classic Prometheus has one glaring Achilles' heel: its built-in TSDB. It was designed to store data on a single server's local disk:
- Once active time series climb into the millions, Prometheus demands hundreds of gigabytes of RAM just to keep its indexes alive.
- To aggregate metrics across multiple clusters and retain data for years, you have to bolt on complex distributed layers like Thanos, Cortex, or Mimir.
VictoriaMetrics tackles this much more cleanly. Fully compatible with PromQL and the remote_write protocol, it uses 10–15x less RAM thanks to compact cache structures and compresses data 7–10x tighter on disk via a columnar merge-tree store.
You can stream metrics from an existing Prometheus instance into VictoriaMetrics with just a few lines in prometheus.yml:
# Forward scraped metrics to a VictoriaMetrics cluster
remote_write:
  - url: "http://victoriametrics:8428/api/v1/write"
    queue_config:
      max_samples_per_send: 10000
      capacity: 50000
      max_shards: 30
In our earlier deep dive into VictoriaLogs internals from ingestion to columnar compression, we saw how much overhead disappears when you drop heavy indexing. VictoriaMetrics and its siblings let you push your scaling ceiling way out without touching a single Grafana dashboard.
Logs Battle: OpenSearch vs. Grafana Loki
While lightweight storage often wins easily for metrics, the architectural fork in logging is much sharper:
- OpenSearch builds full Apache Lucene inverted indexes for every word in every JSON document. You get instant searches across complex regexes and unstructured stack traces. The price tag is steep: disk overhead reaches 3–5x the raw log volume, and the cluster demands tens of gigabytes of expensive JVM Heap on every node.
- Grafana Loki takes a radical shortcut: Loki deliberately does not index log text at all. It only indexes metadata labels (
app,namespace,pod), while packing the raw log lines into compressed chunks stored in cheap object storage (S3, MinIO, or Ceph).
Searching in Loki happens via streaming scans with LogQL:
# Example LogQL query: filter a specific service's logs for panics
{namespace="production", app="billing"} |= "panic:" | json | status >= 500
Storage bills drop by 60–80% after moving to Loki, and clicking an error spike on a Grafana metrics graph jumps straight to that pod's logs using shared labels.
A pragmatic setup for mature teams: keep local Prometheus as a lightweight scraper forwarding to VictoriaMetrics via remote_write, and split your logs—send system and application events to cost-effective Loki, while keeping OpenSearch strictly for security auditing and SIEM workloads.
The decision boils down to one rule: if you need instant full-text search for rare typos across billions of old log lines, pay for OpenSearch. In almost every other scenario, VictoriaMetrics plus Loki delivers massive resource savings.