You probably know that sluggish feeling when you send a heavy analytical prompt to an AI model and then sit there staring at a blinking cursor. Especially if you loaded a massive table, a couple thousand lines of system instructions, and several examples of expected output. Every iteration used to turn into an exercise in patience, while the token bill quietly reminded you that cloud AI is anything but cheap.
When Anthropic rolled out Claude Sonnet 5.5, my first reaction was classic skepticism: "Here we go again, another minor release with a two-percent bump on synthetic benchmarks wrapped in loud marketing." Still, I opened the docs, ran a batch of heavy tasks through the API, and timed the actual generation speed. The difference hits you right away: the model streams tokens more than 30% faster than the base Sonnet 5. Even better, the engineers overhauled the math behind context caching and built interactive Live Dashboards right into the web interface, completely changing how you work with numbers day to day.
Prompt Caching Economics: Why Real Costs Drop by a Third
Let's be honest: at first glance, the base pricing table looks unchanged—still $2 per million input tokens and $10 per million output tokens. So where does the promised thirty-percent savings come from?
The secret is buried in Prompt Caching. In real-world engineering or deep analytics, you almost never send a one-line prompt in isolation. There is always a heavy block of context sitting in the background: database schemas, API docs, company guidelines, or an open repository. In earlier versions, hitting that cache repeatedly still added up fast. In Sonnet 5.5, the cost of reading a cached block was cut in half—down to a mere $0.10 per 1M tokens.
Picture an agentic coding pipeline: the agent runs 15 sequential steps, referencing the same 50,000-token block of instructions and source code on every turn. Previously, that trailing context burned through your budget in minutes. Now you pay once to warm up the cache (minimum block size is 1,024 tokens), and every subsequent step costs next to nothing. Total spend on a typical multi-step pipeline drops by the exact 30% Anthropic claims. For a deeper look at how the new lineup stacks up against larger flagships, check out Claude Sonnet 5.5 vs. Opus 5.5: Speed, Cost, and Quality Benchmarks in Real Tasks.
Here is how ephemeral caching looks in Python using the official SDK:
import anthropic

client = anthropic.Anthropic()

# System prompt with cache_control warms up the cache
response = client.messages.create(
    model="claude-sonnet-5-5-20261022",
    max_tokens=4096,
    system=[
        {
            "type": "text",
            "text": "Ты ведущий аналитик данных. Анализируй финансовые выгрузки и генерируй спецификации дашбордов.",
            "cache_control": {"type": "ephemeral"}
        }
    ],
    messages=[
        {
            "role": "user",
            "content": "Сформируй React-компонент с графиком выручки по подпискам Stripe за последние 30 дней."
        }
    ]
)
print(response.content[0].text)
In the console, Time To First Token (TTFT) on a cache hit drops to fractions of a second. The model jumps straight to the task instead of re-digesting megabytes of static text.
From Static Text to Live Dashboards: How Real-Time Analytics Works
The second half of the update transforms the Claude.ai web interface. Anyone who has ever asked an AI to "analyze a sales spreadsheet" knows the usual drill: the model spits out two paragraphs of summary, builds a dry Markdown table, and maybe renders a basic static chart. If you want to slice the data another way, you either write ten follow-up prompts or copy the numbers back into Excel or Looker Studio.
Diagram of an interactive Live Dashboards component with filter toggles and a dynamic Recharts graph
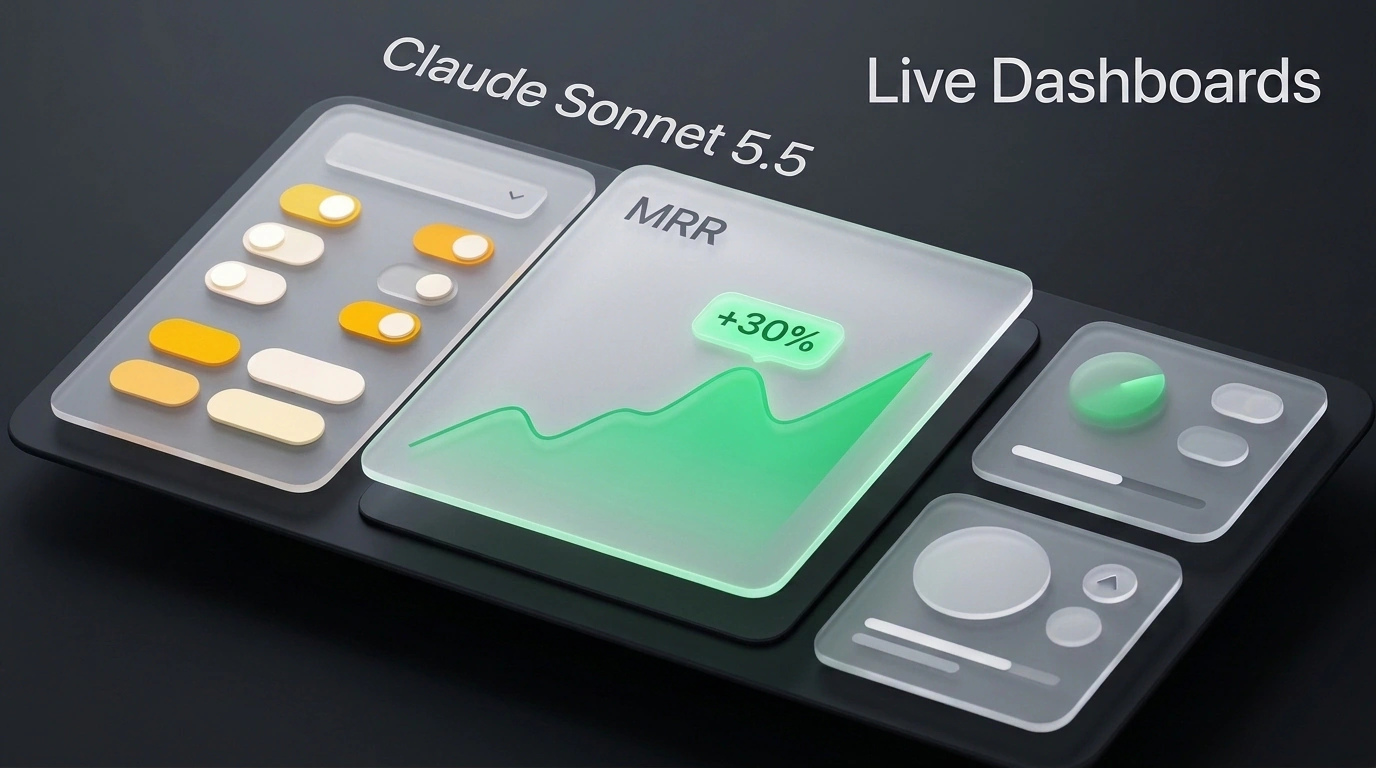
With Live Dashboards, the rules change. Claude now renders full-fledged interactive applications right inside the Artifacts window, powered by React, Tailwind CSS, and Recharts. Charts are no longer frozen images: you can hover over data points, toggle time ranges with filter buttons, hide specific categories, and click through key metrics.
import React, { useState } from 'react';
import { Card, CardHeader, CardTitle, CardContent } from '@/components/ui/card';
import { ResponsiveContainer, AreaChart, Area, XAxis, YAxis, Tooltip } from 'recharts';

export default function RevenueDashboard({ liveData }) {
  const [filter, setFilter] = useState('monthly');

  return (
    <Card className="w-full bg-slate-900 text-white border-slate-800">
      <CardHeader>
        <CardTitle className="text-xl font-bold flex justify-between items-center">
          <span>Динамика MRR и оттока клиентуры</span>
          <div className="flex gap-2">
            <button
              onClick={() => setFilter('weekly')}
              className={`px-3 py-1 text-xs rounded ${filter === 'weekly' ? 'bg-sky-500' : 'bg-slate-800'}`}>
              Неделя
            </button>
            <button
              onClick={() => setFilter('monthly')}
              className={`px-3 py-1 text-xs rounded ${filter === 'monthly' ? 'bg-sky-500' : 'bg-slate-800'}`}>
              Месяц
            </button>
          </div>
        </CardTitle>
      </CardHeader>
      <CardContent>
        <div className="h-72 w-full">
          <ResponsiveContainer width="100%" height="100%">
            <AreaChart data={liveData}>
              <defs>
                <linearGradient id="colorMrr" x1="0" y1="0" x2="0" y2="1">
                  <stop offset="5%" stopColor="#38bdf8" stopOpacity={0.8}/>
                  <stop offset="95%" stopColor="#38bdf8" stopOpacity={0}/>
                </linearGradient>
              </defs>
              <XAxis dataKey="date" stroke="#64748b" />
              <YAxis stroke="#64748b" />
              <Tooltip contentStyle={{ backgroundColor: '#0f172a', borderColor: '#334155' }} />
              <Area type="monotone" dataKey="mrr" stroke="#38bdf8" fillOpacity={1} fill="url(#colorMrr)" />
            </AreaChart>
          </ResponsiveContainer>
        </div>
      </CardContent>
    </Card>
  );
}
But the real game-changer is data connectors. The platform now supports direct integrations with external sources: Stripe, QuickBooks, Gmail, Google Calendar, and Slack. You no longer need to manually export a CSV of transactions, scrub it clean, and upload it into the chat. Once you connect a Stripe webhook or sync your inbox, your dashboard pulls fresh numbers every time you open the artifact. We covered the early steps of this idea in Interactive Dashboards and Code Animations: Claude Dashboards and Motion Beta, and now the feature has finally matured for production use.
If you run Sonnet 5.5 with extended thinking enabled, do not crank the effort parameter to maximum unless you truly need it. At peak settings, the model can burn up to 128,000 tokens deliberating over UI geometry and color palettes before writing a single line of working code. For dashboard layouts and analytics, the high level is more than enough.
Benchmarks and Real-World Maturity: Where the Limits Are
Let's look at objective numbers stripped of corporate hype. On Terminal-Bench 4.0, which tests real command-line interaction, Sonnet 5.5 scored an impressive 70.6%—compared to just 10.3% for the base Sonnet 5. That is a massive leap in understanding shell utilities, system paths, and external tool calls. On SWE-bench Verified (real-world GitHub repository fixes), it comes within striking distance of heavyweight Opus while responding nearly 1.5x faster.
Anthropic also made a bold move by setting Sonnet 5.5 as the default model on the free Claude.ai tier. That means solid coding and fast text analysis are now available to everyone without a mandatory $20 monthly subscription.
Interactive widgets with live Stripe and QuickBooks connectors are currently limited to Pro, Team, and Enterprise subscribers. Also, client-side JavaScript execution is sandboxed inside a strict iframe: the model cannot fire arbitrary fetch requests to third-party domains unless proper CORS headers are configured on the target server.
At the end of the day, this is not just another incremental model bump—it is a genuinely practical analyst workspace. Faster inference and ultra-cheap caching keep API bills in check, while Live Dashboards let you knock out data visualization tasks in minutes right inside your browser, without touching bloated external BI tools.